David Bercovici on How Plate Subduction Starts
David Bercovici is a Professor of Earth and Planetary Sciences at Yale University. He tackles the problem of why Earth has plate tectonics by applying physics at the scale of individual mineral grains. In the podcast, he explains how the behavior of rocks at the microscale can lead to the plate-scale subduction zones that are the main driver of plate tectonics.
Courtesy of Tony Fiorini
Listen to the podcast here or wherever you listen to podcasts.
Scroll down for illustrations that support the podcast.
Note - playing the podcast is not supported on Internet Explorer; please use any other browser, or listen on Spotify, Apple Podcasts, etc.
Podcast Illustrations
This sketch shows a spreading ocean basin with a passive margin and the direction of ridge-push stress. The three model scales are shown: the macroscopic scale of the lithosphere and ocean basin, the mesoscopic scale of the petrological heterogeneity (showing two phases, green and blue, in an unmixed conglomerate of olivine and pyroxene), and the grain scale of individual mineral crystals. On the grain scale, the grain size evolves, and the mixing of the mineral phases is driven by compressive stress. This causes dilation of grain boundaries that are oriented parallel to the compressive direction and constriction on orthogonal grain boundaries, as indicated by the pink arrows in the right inset. This dilation and constriction occurs by subgrains of one phase migrating mechanically or chemically along the other phase’s grain boundaries (green arrows, right inset).
Courtesy of Elvira Mulyukova from Bercovici and Mulyukova (2021), PNAS, 118 (4) e2011247118
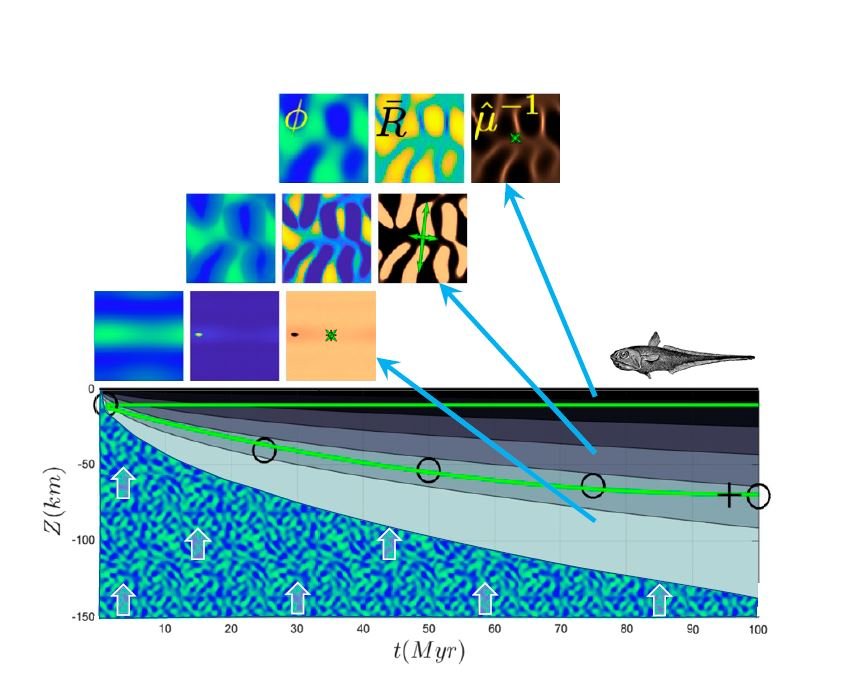
The diagram shows the increasing thickness of an ocean lithosphere as its distance from a mid-ocean spreading center (left axis) increases with its age. The gray contours symbolize the temperature zones from the hottest at the bottom (pale blue) in contact with the mantle below, and the coolest (black) at the sea floor. The thick green lines bound the region in which weak bands accumulate. Below this region, the material is more uniformly weakened; above this envelope, the material is cold and remains poorly mixed, coarse-grained and strong, but also likely subject to brittle failure. The insets show examples of the model’s solutions within each of the domains. Top: little mixing and high strength. Middle: vertical weak bands. Bottom: uniform weakness. Just like the fish, the snapshots of the microstructure are not to scale. Model parameters include the fraction of the minor phase, which is pyroxene in the lithosphere (Φ), the minor phase grain size (R), and the viscosity (µ).
Bercovici and Mulyukova (2021), PNAS, 118 (4) e2011247118
Deforming Rocks in the Lab
Photomicrographs of undeformed (left) and deformed (center, right) samples of an olivine and orthopyroxene conglomerate. These experiments show that deformation, which increases from (b) to (c), drives the mixing of grains with concurrent grain-size reduction and weakening of the rock. γ = shear strain; PT-x is the name of the sample.
Tasaka et al. (2017), Journal of Geophysical Research: Solid Earth 122, 7584


