
John Valley on the Early Earth
Listen to the podcast here, or wherever you get your podcasts.

John Valley operating the secondary ion mass spectrometer (SIMS) ion probe in his lab at the University of Wisconsin.
John Valley is Professor in the Department of Geoscience at the University of Wisconsin. His research on the very oldest rocks and minerals that survive from the earliest eon of Earth history - the Hadean - has uncovered some surprises. One of these is that the early Earth may have cooled quickly, and that much of the Hadean was not, in fact, the scorching hell it was previously thought to be.
Photo courtesy of John Valley
Podcast Illustrations

Artist’s impression of a hot Hadean, with magma oceans, floating “rockbergs,” and meteor bombardments. The Moon’s orbit was closer to the Earth, and there was a dense steam atmosphere.
Image courtesy of Chesley Bonesal

Artist’s impression of a cool Hadean, with liquid water oceans, a basaltic shield volcano, and clement conditions.
Image courtesy of Don Dixon

The Earth’s history is divided into four eons - the Hadean, the Archean, the Proterozoic, and the Phanerozoic. The Phanerozoic was named after the Greek word for life, but microorganisms originated much earlier, and even the animal fossil record starts in the late Proterozoic.
Timeline courtesy of Andrée Valley

The Hadean eon zircons were found in the Jack Hills region of Western Australia.
Image courtesy of NASA

False color satellite image of the Jack Hills region taken in 2004 by the ASTER instrument on NASA’s Terra satellite.
Image courtesy of NASA/GSFC/METI/ERSDAC/JAROS, and U.S./Japan ASTER Science Team

The Jack Hills region of Western Australia is not all hilly, but arid and unpopulated.
Photo courtesy of John Valley

The “discovery outcrop” where Hadean age zircons were first found in these conglomerates by Simon Wilde (right) and others in the 1980s. (John Valley, left; Aaron Cavosie, center)
Photo courtesy of John Valley

Samples taken from the Jack Hills conglomerates. The pits are 5 mm drill holes where samples of quartz were taken for analyzing oxygen isotope ratios. (Quartz is silicon dioxide.) The zircons are concentrated in the dark layers, most clearly visible in the top left sample.
Photo courtesy of John Valley
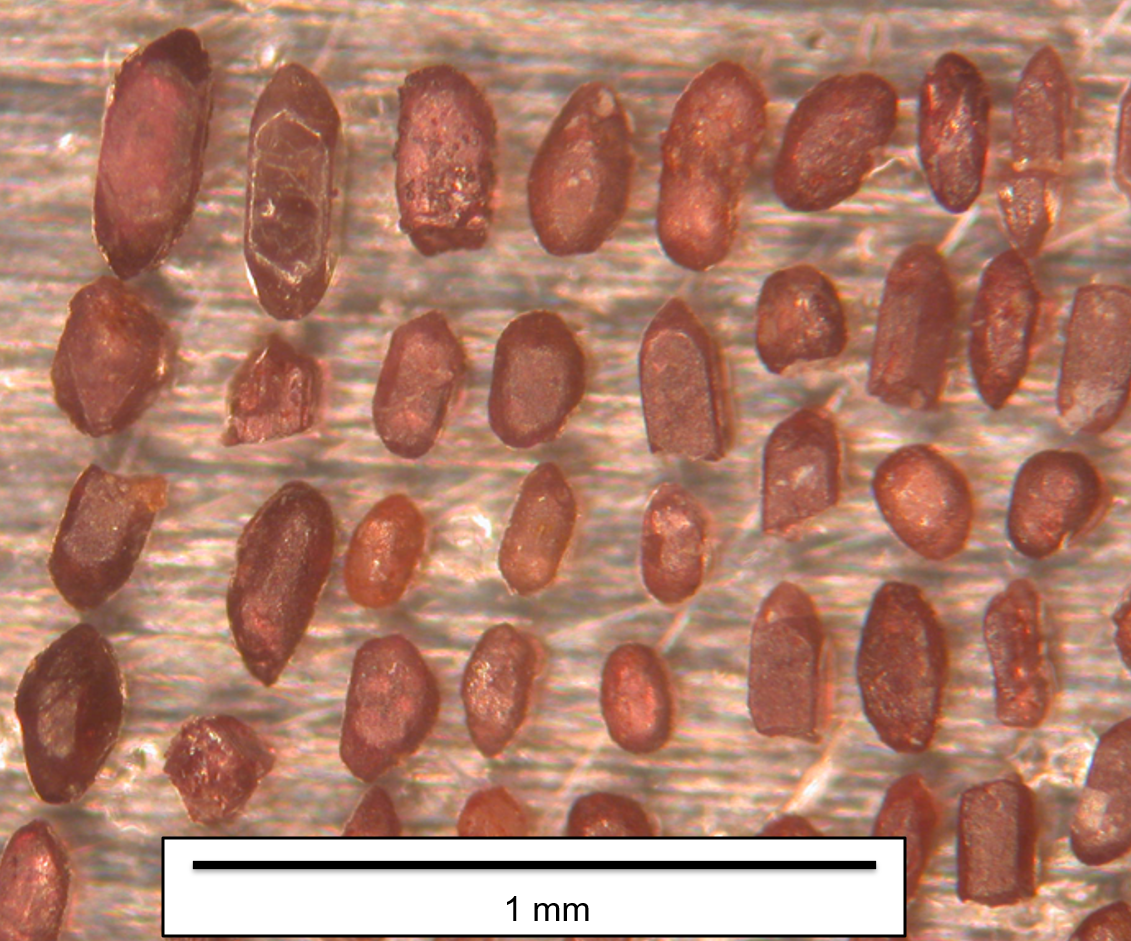
Zircon crystals extracted from the Jack Hills conglomerates. Some are smoothed by abrasion, but others have retained their crystal faces despite their great ages.
Photo courtesy of Jack Valley

Diagram of an ion microprobe similar to that used to date the zircons. An ion gun (yellow) fires a beam of ions onto the zircon sample where it sputters some ions off the surface. These secondary ions are then directed into a mass spectrometer (green) where a strong magnetic field separates the ions out according to their mass. The relative amounts of each ion species is measured with an accuracy of nanograms (blue). The ratio of a parent isotope, such as uranium to a daughter isotope, such as lead, resulting from radioactive decay of the parent yields the age of the sample.
Diagram courtesy of Cameca and John Valley

Image of a zircon crystal using cathodoluminescence (CL). The crystal is placed in an electron microscope and “illuminated” with an electron beam. The electrons cause the crystal to emit light that reveals its internal structure. The CL image here shows that the zircon is zoned, each zone reflecting a growth phase when the crystal accreted more material from a surrounding melt. By directing the ion probe beam onto different portions of the crystal, we can date the various phases of the crystal’s growth. This particular grain has a history that spans almost a billion years.
Image courtesy of John Valley, Valley et al., Nature Geoscience, 2014 Vol. 7, 219

The results from measuring the uranium lead isotope ratios in the zircon crystal shown above. This is a concordia diagram, since it shows whether the ages derived from each of two independent uranium to lead decay pathways are consistent with each other. Concordant ages must fall on the solid line. Each probe of six different probe beam locations were analyzed and plotted on this concordia diagram together with their error ellipses. All three of the ages obtained from the core region are concordant, with ages just below 4.4 billion years. Measurement #4 on the crystal rim is concordant, with an age of 3.4 billion years.
Diagram courtesy of John Valley, Valley et al., Nature Geoscience, 2014 Vol. 7, 219