
Matt Jackson on the Heterogeneity of the Mantle

Matt Jackson is a Professor of Earth Science at the University of California, Santa Barbara. He probes the chemical composition of the mantle by analyzing trace elements and isotopes in hot-spot lavas from around the world. In the podcast, he describes the intriguing heterogeneity among the hot-spots of the so-called “hot-spot highway” in the western Pacific. The heterogeneity there, as well as on larger spatial scales, is challenging our ideas about the motions of the mantle over the billions of years of Earth history.
Listen to the podcast here or wherever you listen to podcasts.
Scroll down for illustrations that support the podcast.
Note - playing the podcast is not supported on Internet Explorer; please use any other browser, or listen on Spotify, Apple Podcasts, etc.
-
This transcript was generated automatically and lightly edited for readability.
Oliver Strimpel: This is Geology Bites with Oliver Strimpel. The mantle makes up 84 percent of the Earth's volume. Because it's covered by the plates of the lithosphere, information about its chemical composition is hard to come by. It mostly comes from lavas that we believe are sourced from the mantle, and most of these lie under the ocean, which is a notoriously difficult place from which to obtain samples. But as we manage to extract more and more mantle-sourced lava samples, some very unexpected patterns in mantle composition are emerging. Matt Jackson is a professor of earth science at the University of California, Santa Barbara. His research focuses on the isotopic and chemical composition of lavas erupted at hotspot volcanoes. Matt Jackson, welcome to Geology Bites.
Matt Jackson: Thank you, Oliver. Thanks for having me today.
Oliver Strimpel: I just managed to catch you before you embark on a research vessel for a six-week trip, starting in Guam and heading down to the South Pacific. Is that to sample seafloor lavas there?
Matt Jackson: Oh yeah, absolutely. We have the older portions of a couple of long-lived oceanic hotspots that exhibit some volcanism in the western Pacific. These hotspots are very similar to the archetypal hotspot, the Hawaiian hotspot. The Hawaiian hotspot has about 80 million years of recorded volcanism, and the older portion of the Hawaiian hotspot, of course, is subducting into the Kamchatka trench. The two hotspots that we'll be looking at go back over 100 million years, and therefore we're looking at over 100 million years of continuous volcanism of these two hotspots, and their older portions are now located in the western Pacific and subducting into the Mariana Trench. So we'll be out there to look at the older portions of these two long-lived hotspots.
Oliver Strimpel: But there are quite a few hotspots that erupt lavas above the oceans, Hawaii being the obvious example you just mentioned, but also Samoa and the Canary Islands and a few others. Why go to all the trouble to sample them below the oceans?
Matt Jackson: The main issue with volcanoes in oceanic settings is that very few of the volcanoes actually make it above sea level. We have on the order of a hundred thousand seamounts that are a kilometer high or higher above the ocean floor, whereas we're dealing with perhaps hundreds of islands in oceanic settings. So by tackling the submarine volcanoes, we greatly open up the number of volcanoes that we can explore, to better disentangle the histories of these different hotspots.
Oliver Strimpel: Wow, that's a really overwhelming statistic. I had no idea. Let's return to your upcoming voyage to the South Pacific. Prior surveys have been able to identify a bunch of hotspot trails. In fact, I think you told me that it's even referred to as a hotspot highway. So how do we know that these are hotspot trails?
Matt Jackson: Oceanic hotspots are thought to generate age-progressive volcanic trends. So you have an oceanic plate that's moving laterally over an upwelling plume. You generate a volcano above the upwelling plume, but as the plate moves off that hotspot, another volcano forms in its place. And that volcano then gets rafted off laterally, and another volcano forms in its place, and so forth. You end up generating a nice, linear, age-progressive trend. Hawaii, of course, is the classic example, but we have other examples in the Pacific, for example the Samoan hotspot and the Macdonald hotspot, and some lesser-known hotspots, like the Arago hotspot. Now, several hotspots in the South Pacific are aligned along the trend of plate motion, so along the flow line of the Pacific plate. So we have the Macdonald hotspot, the Arago hotspot, perhaps the Rarotonga hotspot, and the Samoan hotspot, all aligned. They're all about 1,000 to 1,200 kilometers apart, and because they're aligned, downstream of the easternmost hotspot, so to the west of the easternmost hotspot, the Macdonald hotspot, you have Macdonald hotspot seamounts that are accumulating and overlapping around the Arago region, the Rarotonga region and the Samoan region further to the west. And so we have these four hotspots in a row that are generating what we refer to as the hotspot highway, because we have this continuous trail of seamounts that have been generated by the various hotspots along this trend. Well, if we go further to the western Pacific, these hotspots then change trend, right? So if you look at the Hawaiian hotspot, for example, you have this beautiful bend in the Hawaiian hotspot track at about 50 million years, where the trend of the hotspot goes from approximately east–west to closer to north–south. We call this the Emperor trend, and this dominates the strike of the Hawaiian hotspot over much of the Cretaceous. We see similar bends in these hotspots from the hotspot highway. The issue is that we have this province with thousands of seamounts, but very few of them have ever been sampled, characterized geochemically or dated, so it's hard to tell which of the four hotspots from the hotspot highway these various seamounts came from. So we're going to head out to that part of the Pacific on our upcoming expedition to sample and then later characterize these various seamounts, to see if we can disentangle the different hotspots from the hotspot highway.
Oliver Strimpel: So just about all these seamounts, well, they're seamounts, so they're under the water. So what kind of ocean depths are we talking about here, where you're going to be sampling?
Matt Jackson: The ocean depths in the western Pacific, at least outboard of the trench, are around 5,000 meters. So we'll be getting samples from as deep as 5,000 meters, at the base of these seamounts, and in some cases we might be going as shallow as 3,000 meters. But we want to be getting the deepest portions of these volcanoes, to sample the deepest stratigraphy and capture the earliest stages of volcanism on each of these hotspots. Of course, as we go further to the west in this western Pacific seamount province, we'll be getting closer to the trench, so the ocean bathymetry deepens, where depths go to, as we know, about 11,000 meters. Some of the seamounts that are going into the trench will be harder for us to sample; we'll be spooling out a lot of dredge cable to get the deeper portions of these seamounts that are currently gliding into the trench.
Oliver Strimpel: That's a fantastic amount of water to be working under. How do you find the right places to sample? I mean, how do you know you're not going to just be sampling recent sediments that tell you nothing whatsoever about the lava underneath?
Matt Jackson: Eighty to ninety percent of the ocean floor remains unmapped to any reasonable degree. So we rely on satellite-based, or gravity-based, bathymetry, and the gravity-based bathymetry has a resolution of about a kilometer, and I think a kilometer in many cases is being generous. But it allows us to see where the big bumps are in the ocean floor. These bumps are the seamounts. So what we do with the ship is we target specific seamounts, and we make high-resolution maps using multibeam sonar. And these high-resolution maps allow us to get much finer resolution of the seamount bathymetry, the contours of the seamount at depth. And based on this information, we can target the steepest portions of the seamount for sampling, specifically the portions that are not only steep but highly reflective to sonar. And the reason we do this is because surfaces that are reflective to sonar tend to be sediment-poor, so we're more likely looking at solid rock surfaces, or ferromanganese-rind-encrusted rocks. Furthermore, we target the steeper portions of the seamounts as well because of sediment and debris, like corals, for example; lots of these seamounts were actually at the surface at one point, before erosion and subsidence. The steeper portions of these seamounts allow the corals and debris to slough off, allowing us to directly sample the basaltic bedrock of the seamount. For the bigger seamounts, we can spend 8 to 10 hours trying to get decent maps of the flanks of the seamount to identify the best dredge targets, and then the dredging itself can also take eight to ten hours, depending on water depth, of course, and whether or not the dredge gets stuck on the ocean floor.
Oliver Strimpel: So I'm curious, with 5 kilometers of cable strung out below your ship, and presumably ocean currents and who knows what moving this thing around, you may know where you are from the sonar, but how do you know where the dredge is going to be? Do you have a camera down there or something?
Matt Jackson: We don't have a camera on the dredge cable. If we put a camera on the dredge cable, it would probably get torn off pretty early on in the dredging process. The dredging process is a tried and tested technique. I like to refer people to Sigsbee's paper from the early 1880s, showing a drawing of a dredge that is not unlike the dredges that we're using now, 140 years later. Basically, we spool out cable, 5, 6, 7 hours' worth of 30,000-pound-test cable, until we can get the dredge basket down on the ocean floor. The issue is that we never know exactly where the dredge basket is, because at five kilometers depth, you can have ocean currents that are moving in a different direction from those at the surface, and the dredge basket can get pulled off a little bit to one side or the other. So what we do is target the seamount in regions well above the abyssal plains, and we have a pretty good sense, say within several hundred meters, of where the dredge basket actually ends up. Now, you might say, well, Matt, this isn't as good as the GPS sampling we have on ocean islands, where we can record the location of a rock to better than a meter. And that's true, absolutely true. But on the other hand, the seamounts that we're targeting have never been mapped; they've never even been sampled. And so having one sample from such a seamount is incredibly valuable, because then we know its composition, we know its age, and we can figure out how it formed. In some cases, all we have is one rock that comes on board, and so that makes the rock very valuable to us. Everybody wants a split of the rock. And sometimes I reflect on this and tell the graduate students who are on the ship for the first time that that rock can represent $50,000 worth of resources, because when we're out at sea, it's about $50,000 a day to run these ships: the fuel's incredibly expensive, maintaining the ship, the salaries for the crew and the scientists.
Oliver Strimpel: How big are your samples?
Matt Jackson: Typically, samples range in size. The upper end is limited by the opening in the dredge basket; that's 40 centimeters or so, so we can get some pretty sizable pillow basalt chunks. And we put burlap sacks, and sometimes fine netting, inside the base of the bags, so that we can capture the smaller samples. We drag these dredges on the seafloor up the sides of these seamounts for hundreds of meters; in some cases we'll go a kilometer. It takes so long to map a seamount, and it takes so long to lower the dredge basket down 5,000 meters and bring it up 5,000 meters, that we want to make sure we bring that dredge basket up plum full of rocks. So we'll drag the dredge basket in some cases for hundreds of meters, or a kilometer, just to make sure we get rocks in there.
Oliver Strimpel: Okay. So you bring these lava samples back to your lab, and you make a number of chemical and isotopic measurements on them. What actually are you trying to find out about these samples?
Matt Jackson: So, two things. We want to figure out the composition of these samples, and we want to figure out their age, so that we can then determine which hotspot these samples came from. Each of the hotspots that I've described has unique geochemical signatures. So we'll measure the radiogenic isotope compositions of the samples, for example radiogenic strontium, radiogenic neodymium, hafnium, lead, osmium and so forth, to really characterize the geochemical fingerprints of the samples, so that we can then say which hotspot each of these seamounts came from. And by the same token, we'll get age dates on these samples to then figure out where on the age–distance trends of these various hotspots the particular seamount fits. Now, for me, a big-picture question is why these different seamounts, or hotspots, have different geochemical fingerprints. And it turns out the geochemical fingerprints can be so good at identifying specific locations that my former thesis advisor liked to joke that if he didn't have GPS, and someone put him on a remote desert island with just a clean lab and a mass spectrometer, he could, based on the composition of the basalt on that island, pinpoint which island he was on.
Oliver Strimpel: But what does this geochemistry then tell us about the composition of the Earth's interior?
Matt Jackson: Well, it turns out that the composition of the Earth's interior is highly heterogeneous, due to a number of processes, and one that we focus on a lot, and in this particular expedition coming up, is the process of subduction. So oceanic crust and continental crust, or materials derived from continental crust, enter the mantle at subduction zones. When two plates collide, inevitably one of the plates goes down into the Earth's interior, and then the big question is, what happens to that plate after subduction? Well, we think that plate goes down deep into the mantle, resides down there for some period of time, and then is conveyed back to the surface again in upwelling plumes. It partially melts, and then we look at the lavas at hotspots to identify the signatures of what went down in ancient trenches deep in geologic time. And we find some key geochemical signatures that are associated with different subducted materials that went down into ancient trenches. So for example, recycled oceanic crust, we believe, can generate radiogenic lead isotope signatures over time, and sure enough, some hotspots show some really clear radiogenic lead isotopic compositions. Similarly, continental crust, or materials derived from continental crust, that was subducted in deep time should have very radiogenic strontium isotopes and very unradiogenic, or low, 143Nd/144Nd neodymium isotopic characteristics. And we see these particular characteristics, for example, in the Samoan hotspot. In fact, the Samoan hotspot has exhibited these isotopic characteristics, based on preliminary data, over a hundred million years of its history. So one of the reasons we're going back to the western Pacific is because we think we've picked up the scent of the Samoan hotspot, based on some legacy samples obtained 20 to 40 years ago on various expeditions. What we see is that the Samoan hotspot has continuously sampled these recycled continental crust signatures for the 100 million years of its recorded volcanism.
Oliver Strimpel: So I can understand that particular compositional ratios, if you like, of these various trace elements and isotopes can act as a kind of fingerprint or signature. But do we actually understand the mechanism, for example, whereby subducted oceanic crust results in more radiogenic lead?
Matt Jackson: We know why that is. There are a couple of different proposed mechanisms, and the one that I favor is that oceanic crust, when it enters the subduction zone, goes through various metamorphic reactions that result in dehydration and loss of fluid-mobile elements. And we believe that lead is preferentially lost relative to uranium and thorium. And this becomes important because uranium and thorium, when they undergo radioactive decay, ultimately end up as the various radiogenic isotopes of lead. Lead-208 is the result of decay of thorium-232, and lead-207 and lead-206 are the result of radioactive decay of uranium, of two different isotopes of uranium. And so when oceanic crust enters a subduction zone and loses its lead relative to its uranium, you're setting up the opportunity to generate an overwhelmingly large amount of radiogenic lead in that downgoing slab after it's been aged in the mantle for a couple of billion years. And indeed, we see very radiogenic lead isotope ratios in some hotspot lavas, and one of the hotspots that we're going to be targeting has exhibited radiogenic lead isotope signatures for over 100 million years. This is sort of remarkable, that one hotspot can sample a mantle source composition deep in the mantle for a hundred-million-year period. Meanwhile, that hotspot, Arago, is only 2,000 kilometers away from the Samoan hotspot, which has been sampling not radiogenic lead but instead radiogenic strontium and unradiogenic neodymium for its hundred-million-year history. So you have two hotspots that are 2,000 kilometers apart at the surface, and of course much closer at the bottom of the mantle, right? At the base of these plumes, they're only going to be about a thousand kilometers apart. These two plumes are sampling geochemically distinct sources, even though they're a thousand kilometers apart, over a hundred-million-year period. This is completely remarkable to me, and, you know, I still don't have a satisfying explanation for how this is possible. It seems like the plume feeding zones for these hotspots should be overlapping with each other. We should see these two hotspots sharing geochemical signatures, but they've remained remarkably distinct, in spite of being so close together geographically, over this hundred-million-year period that they've been active.
Oliver Strimpel: So what kind of signatures have we been able to identify? You mentioned that we can see if there's a signature from subducted oceanic lithosphere, and also signs of continental crust, or crust-derived materials. Are there any other signatures that we can identify, and do we know what they represent?
Matt Jackson: There are signatures in the mantle that are left over from the very earliest days of the Earth. And it appears that the mantle domains that have been able to preserve these really ancient signatures are the domains that have been least impacted by mixing with subducted crust, of the oceanic or continental varieties. And these early-formed, or ancient, domains are characterized by one very key signature that a lot of people have focused on, and that's high helium-3 over helium-4 ratios. Elevated helium-3 over helium-4 is a signature that we associate with primordial materials in the solar system. So for example, we know from the Galileo spacecraft that the atmosphere of Jupiter has a helium-3 over helium-4 ratio that is 120 times that which we have in the Earth's atmosphere. Helium-3 is a primordial isotope of helium; very, very little of it is made inside the Earth. Some portion of the helium-4 in the Earth's interior is primordial, but helium-4 tends to accumulate in the Earth and increase in abundance, because uranium and thorium decay by alpha decay, and those alpha particles are simply helium-4 nuclei. And so we end up generating helium-4 throughout the Earth, and especially in these mantle domains that have recycled oceanic and continental crust. Now, some new work has been coming online recently: oceanic lavas with elevated helium-3 over helium-4 ratios have these unusual tungsten-182 anomalies. So what does this mean? Tungsten-182 is the byproduct of hafnium-182 decay. Hafnium-182 is a very short-lived radioactive isotope; in fact, its half-life is only about nine million years. And so after a handful of half-lives had occurred, say 50 or 60 million years after terrestrial accretion, there was essentially no hafnium-182 left on the planet. So any tungsten-182 anomalies that were formed on the Earth were formed in the first 50 to 60 million years of Earth's history. And the fact that we're seeing tungsten-182 anomalies in modern hotspot lavas tells us that this ancient signature, generated in the very earliest history of the planet, has somehow survived, despite mantle convection and the chaotic motions of the mantle, and the mixing and stirring with oceanic and continental plates that are subducted into the Earth's interior. Somehow the signature has survived for over four and a half billion years of Earth's history. The community is still trying to figure out the origin of this tungsten-182 signature. One idea is the concept of core entrainment: a little bit of the Earth's core has leaked its way into the base of the mantle and then been entrained in upwelling mantle plumes. This raises the possibility of mantle plumes that are not only sampling subducted oceanic crust and continental crust, but might also be sampling bits of material derived directly from Earth's core. It remains to be seen whether or not we're actually dealing with a core signature in modern hotspots. It may be possible that the tungsten-182 signatures could be byproducts of the early accreted materials from when Earth was forming, and this is a debate that's going to be resolved only with a new generation of additional data, looking at other isotope systems that are sensitive to core formation or to terrestrial accretion.
Oliver Strimpel: Do we see evidence of subducted continental crust and oceanic crust, so to speak, polluting the mantle and generating these heterogeneous mantle domains over the entire history of the Earth?
Matt Jackson: It appears that there are two distinct stages of subduction of material into the Earth's interior. It looks like oceanic crust began subducting several billion years ago, but it doesn't look like continental crust began subducting until more recently, perhaps the late Neoproterozoic. And we've been looking at the geochemical distribution of hotspot lavas, and it sure seems to be consistent with this kind of picture.
Oliver Strimpel: If we can see that continental crust only seems to subduct from the late Neoproterozoic, I guess about 650 million years onwards, which is actually something that was mentioned by Peter Cawood in his podcast on the origin of plate tectonics (and in fact some people take that as evidence that plate tectonics didn't start until this late date), do we see the signature of oceanic lithosphere in the mantle before that time?
Matt Jackson: So unfortunately, ocean island hotspots, and the islands and seamounts resulting from these hotspots, really only give us records that go back as far as the age of the oceanic crust they're sitting on, so it's really about 200 million years. But if we want to look at longer-term records, we can turn to kimberlite volcanism.
Oliver Strimpel: Let me just interject here to say that in kimberlite volcanism, rocks from the mantle called kimberlites are brought to the surface in small but powerful eruptions in continental settings.
Matt Jackson: What we see is that the enriched mantle signatures that we associate with subducted continental crust really only start to appear in the Mesozoic, and there's no signature whatsoever in the kimberlite record for subducted continental crust prior to the last couple of hundred million years. And this is really interesting, and I think it's consistent with very recent subduction of continental crust. If continental crust has only been subducted in the last 650 million years, then you wouldn't expect to see continental crust signatures really showing up until after 650 million years ago. Then you might be saying, Matt, why is it that we have this 400-million-year lag between the first subduction of continental crust, at about 650 million years ago, and then the appearance of recycled continental crust in kimberlites, at about 200 million years ago? And I think that's just based on the amount of time it takes for subducted material to make its way down into the Earth's interior, where it then resides for some period of time, and then it's entrained and brought to the surface in mantle plumes. I think that that cycle is probably going to be a few hundred million years. What's really interesting to me is how subducted continental crust shows a really narrow geographic distribution in the Earth's interior.
Oliver Strimpel: So what can we say about the spatial distribution of these mantle signatures?
Matt Jackson: Let's start with the larger scales. The most geochemically enriched signatures, which we often associate with subducted continental crust materials, tend to be focused in the southern hemisphere. The 11 hotspots with the most geochemically enriched signatures, specifically the lowest 143Nd/144Nd, which we associate with subducted continental crust materials, are all located in the southern hemisphere, or up to the equator. Why do we have continental crust signatures isolated in the southern hemisphere? Some early work suggested that it may have something to do with Gondwana, because Gondwana, and then Pangaea, were assembled primarily in the southern hemisphere, so you had a lot of continental collisions and subduction going on in the southern hemisphere that could deliver a lot of subducted continental crust into the southern hemisphere mantle. The problem with this model, ever since it was first suggested in 1984, was that it doesn't explain why we don't have subducted continental crust in the northern hemisphere, when continents were located in the northern hemisphere and subducting in the northern hemisphere in the Archean, way before the assembly of Gondwana and Pangaea. And this is where we're making the link to the initiation of continental crust subduction in the late Neoproterozoic. It's only in the late Neoproterozoic that continental crust was able to first start making its way into the Earth's deep interior, and the continents were located in the southern hemisphere. Before the late Neoproterozoic, we don't have any evidence from the geologic record of continental crustal rocks making it to ultra-high-pressure conditions. Continental crustal rocks were just not going deep yet. The thermal history and the conditions of the Earth's interior, including the rheology of slabs, didn't seem to be conducive to transporting buoyant continental crust deep enough into the mantle that it could undergo the necessary phase changes for continental crust to become negatively buoyant and continue on into the Earth's deep interior. So starting in the late Neoproterozoic, and not before, we have these conditions where continental crust can subduct for the first time, and the continents are also located in the southern hemisphere. This is a perfect alignment of conditions.
Oliver Strimpel: In a couple of previous podcasts, such as the ones with Barbara Romanowicz and with Allen McNamara, we talked about another very large-scale feature in the mantle, which occurs below southern Africa and below the South Pacific, where the mantle seismic wave speed is lower than average: the so-called large low-shear-velocity provinces. Do these affect the distribution and chemical signatures of hotspots?
Matt Jackson: We've known since 1988 that all the geochemically enriched hotspots, with these recycled continental crust signatures, are geographically associated with, or lie above, these LLSVPs. I don't have a great answer for why there is this focus of recycled continental crust signatures over the LLSVPs. It may have a lot to do with just how mantle convection is set up around the LLSVPs. We know, for example, that the location of subduction zones anticorrelates with the LLSVPs today, and has done for the last couple of hundred million years at least. So that can be interpreted as: subduction zones represent regions of downwelling in the mantle, and then the return flow occurs over the LLSVPs, so you have mantle upwelling over the LLSVPs. So in this type of system, where you have downwelling at the subduction zones and upwelling over the LLSVPs, subducted continental crust is going to be drawn into the LLSVPs and tend to accumulate there over geologic time. So then it's perhaps not surprising that we see continental crust signatures showing up at hotspots that are located above the LLSVPs.
Oliver Strimpel: Let's talk a bit about mantle heterogeneities that we see on smaller scales. I'm reminded of the recent podcast about the Icelandic eruption of 2021, with Ed Marshall, where over the space of just a couple of months, the chemistry of the lava, which is thought to have come from the mantle, varied quite dramatically, and the speculation was that a new batch of magma with a different composition may have been injected into the source region there. So does this tell us something about mantle heterogeneity on the meter or kilometer scale?
Matt Jackson: I was lucky to be living in Iceland this last year, and had a great time with Ed Marshall in the field, observing this eruption. The rapid change in the geochemistry of the eruption completely changed the way that I view ocean island volcanism, and specifically the dramatic change in geochemistry of this eruption over just a few months was remarkable. It went from a relatively geochemically depleted signature to a more enriched signature. And this tells me that the volcano is being fed by a couple of different magma chambers that are being sourced by different mantle source compositions, and that these mantle sources must be relatively close to be contributing melt to magma chambers beneath the same volcano. So on the one hand, we have the very largest-scale geochemical anomalies in the mantle, which seem to span entire hemispheres, but on shorter length scales, we seem to have juxtaposition of different mantle domains with distinct geochemical signatures that are close enough together to be able to source a single volcano with distinct signatures over the course of a single, relatively short-lived eruption. Before this eruption, I had convinced myself that I could sample a lava from a lava flow and that that was going to tell me about the isotopic composition of that eruption. But in Iceland, we have an eruption that went on for just a few months, and the flows that came out of that single eruption spanned the entire range of isotope compositions that has been sampled by all the volcanoes along the entire Reykjanes Peninsula in Iceland for the last 10,000 years. In one eruption.
Oliver Strimpel: What about on even smaller scales, like meter or centimeter?
Matt Jackson: Xenoliths can show relatively dramatic isotope heterogeneity at short length scales. In one xenolith from the Samoan hotspot, each grain in the sample tended to show pretty different strontium and neodymium isotope signatures relative to other grains in the sample. In fact, the isotopic variability in this 3-centimeter xenolith spanned a quarter of the total variability of strontium isotopes that we have identified in the Earth's oceanic mantle. One sample, 3 centimeters wide, is sampling 25 percent, a quarter, of the variability that we have identified in the oceanic mantle across all the world's ocean basins. So it's sort of mind-boggling that we zoom in on one sample and the isotopic complexity literally explodes.
Oliver Strimpel: Wow. In light of all these mantle compositional variations that you've just described, both temporally, as in the total transformation of the eruption in Iceland over a couple of months, and spatially, down to the centimeter scale in the xenolith, is the whole notion of a geochemical signature for a seamount or its parent hotspot still a valid idea?
Matt Jackson: Oh yes, absolutely. The Icelandic eruption tells us that a single eruption just samples a wider range of compositions than we knew before, but all of the lavas that have come out of this 2021 Icelandic eruption are still very clearly Icelandic. What's surprising, though, is that we're sampling this incredible range of compositions in just 60 days. In the case of the Samoan xenolith, what we're trying to do is get at the smallest length scales of spatial variability. These xenoliths are still very much Samoan in composition; the important observation is that the range of strontium isotope compositions that we observe in Samoa is observed at a very, very small length scale. I also want to emphasize that a lot of the topics that I've discussed here are cutting edge. They're so new that they're all in the review process. For example, the hotspot highway story, where we're tracing the Samoan and the Cook–Austral hotspots back 100 million years: this is a story that's in review in Nature. The Icelandic eruption work is also in review in Nature. And the late Neoproterozoic subduction of continental crust being responsible for the southern hemisphere isotope enrichment: this is also in review.
Oliver Strimpel: Matt Jackson, thank you very much, and good luck with your upcoming voyage.
Matt Jackson: Thank you, Oliver. Thanks for having me today.
Oliver Strimpel: For more about Geology Bites, as well as pictures and illustrations that support this podcast, you can go to geologybites.com.
Podcast Illustrations
Images courtesy of Matt Jackson unless otherwise indicated.

The R/V Kilo Moana is an oceanographic research vessel with equipment for geophysical, physical oceanographic, meteorological, and radioisotope research. This is the vessel Matt Jackson used for his expedition to the western Pacific in early 2022 to sample deep-sea lavas from hot-spots of the “hot-spot highway.”
Courtesy of the University of Hawaii

Sigsbee dredge design, 1880 (left).
Modern dredge being lowered into the water (right) and returning full of sea-floor rocks (far right).

Courtesy of Science party, RR1310 expedition

Courtesy of Evelyn Mervine
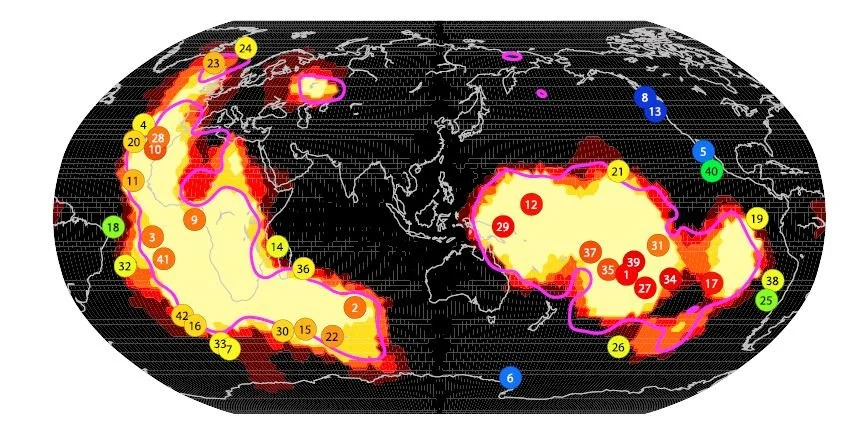
Hot-spot location map. The dot colors indicate how far each hot-spot is from a large low-shear-velocity province (LLSVP). Red, orange, and yellow dots lie within the LLSVP zone, and blue dots lie the farthest away. The LLSVPs are shown as the yellow regions.
Jackson, M.G et al. (2018), Geochem. Geophys. Geosyst. 19 doi:10.1029/2018GC007552

Hot-spots in the Pacific. The trail of extinct volcanos from the Samoan hot-spot and the Rurutu hot-spot (also known as the Arago hot-spot) can be traced for at least 100 million years before they subduct at the Mariana Trench. The Hawaiian trail is cut off at an age of 78 million years by subduction at the Kuril–Kamchatka Trench.
Courtesy of Jasper Konter and Matt Jackson

Enlargement of a portion of the figure above showing the overlapping hot-spot trails of the hot-spot highway in the western Pacific. Using radiometric dating and geochemical analysis, we can associate each seamount to its parent hot-spot, as indicated with the color-coded diagram of the seamounts along the bottom of the map.
Jackson, M.G. et al. (2010), Geochem. Geophys. Geosyst. 11, doi:10.1029/2010GC003232.

High-resolution sonar map of a seamount in the hot-spot highway region near American Samoa. The resolution and reliability are orders of magnitude better than that of the satellite gravity-based sea-floor surveys, but only small regions can be mapped in this way since the exercise is very time-consuming. Such maps reveal zones of high sonar reflectivity that indicate a relative lack of sonar-absorbing sedimentary cover. This in turn suggests that the bedrock lava may be exposed, and therefore accessible to the dredge. Steeply sloping areas are also preferred, since coral and other surface material are more likely to have been sloughed off there. The contour lines show 100 m depth intervals, and background color represents the product of sonar reflectivity and slope: Warm colors indicate surfaces that are both steep and reflective, representing ideal dredging targets. Four dredge targets are shown as red lines. This seamount is about 17 miles across. For comparative purposes, the R/V Kilo Moana is smaller than the degree (°) symbols on the axes of the figure.
Courtesy of Zach Eilon

The diagram illustrates the standard model whereby material from subducting plates mixes with regions of the mantle and imparts characteristic trace element signatures on them. HIMU is a mantle reservoir containing a high uranium-to-lead ratio arising from recycling oceanic crust over billions of years. Other signatures (EM1, EM2) reflect recycling and long-term storage of materials derived from continental crust. The recycled material constitutes anywhere from less than a percent to 10 percent of the enriched mantle region.
Workman et al. (2004), Geochem. Geophys. Geosyst., 5, Q04008
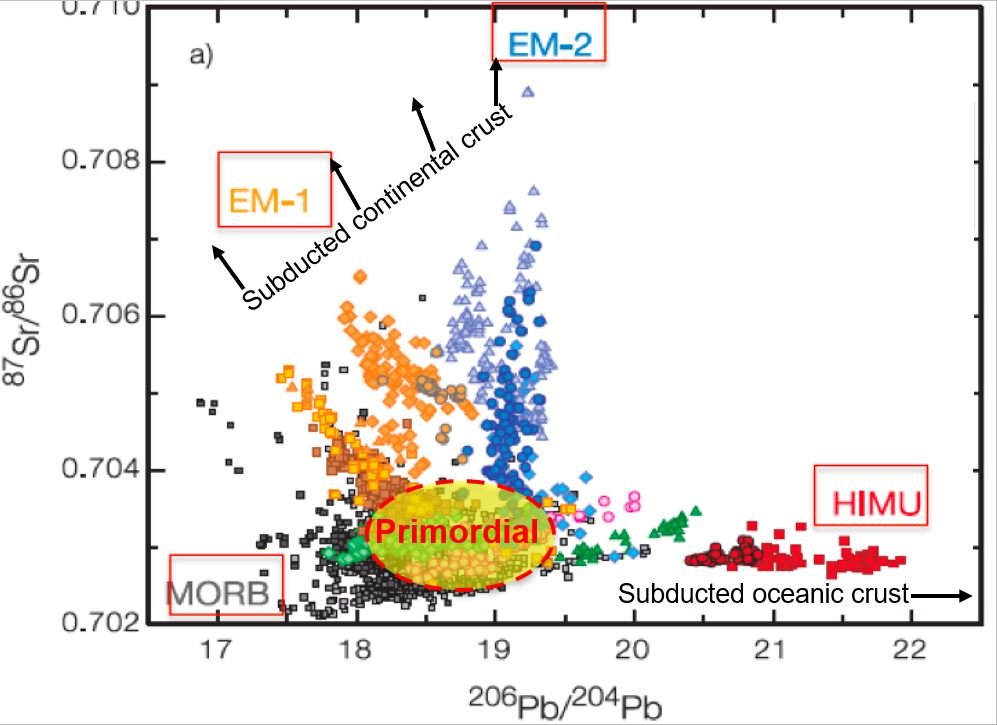
Plot of strontium isotope ratios vs. lead isotope ratios for oceanic hot-spot lavas from various localities. The partitioning into the different regions of the plot provides one type of geochemical signature that distinguishes the different mantle reservoirs. MORB = mid-ocean ridge basalt. HIMU = high uranium-to-lead ratio from ancient subducted oceanic crust. EM1 and EM2 are associated with ancient subducted continental crust.
Willbold et al. (2006), Geochem. Geophys. Geosyst. (2006) 10.1029/2005GC001005

Positions of the continents at present and at 500 million years ago. A. Pre-Mesozoic (i.e., older than about 250 million years) continental plates are shown in dark grey with present continental outlines in light grey for reference. The location of oceanic enriched mantle (EM) hot-spots are shown as red circles, and the continental and non-enriched mantle oceanic hot-spots are shown as blue squares. The pink shaded regions delineate the large low-shear-velocity provinces. B. Reconstruction of continents at 500 million years ago showing that the distribution of continents was primarily in the southern hemisphere during the formation of the Gondwana supercontinent. In the podcast, Matt Jackson suggests that the hot-spots in the southern hemisphere may have enriched mantle signatures resulting from mixing with subducted continental or continent-derived material associated with the assembly of Gondwana.
Jackson et al. (2021), submitted to Nature https://doi.org/10.31223/X5NP7V

Xenolith from the Samoan hot-spot. The xenolith is primarily composed of the minerals olivine (large bright green minerals) with lesser abundances of orthopyroxene (large dark green minerals) and minor amounts of clinopyroxene (small apple green grains that are difficult to make out in the image) and spinel (small dark grains). Matt Jackson found an unexpectedly large variation in trace element and isotopic composition between different clinopyroxene crystals within this 3 cm sample. This tells us that inhomogeneities in the mantle exist on very small scales.