
Barbara Romanowicz on Seeing Deep into the Earth

Barbara Romanowicz is a Professor of the Graduate School at the University of California at Berkeley, and Chair of Physics of the Earth’s Interior at the Collège de France in Paris. She uses the seismic waves triggered by earthquakes to probe the interior of the Earth. Using her training as a mathematician, she has forged new techniques for analyzing these waves to give us a much sharper view of the deep structure of the Earth.
Photo courtesy of the University of British Columbia
Listen to the podcast here, or wherever you get your podcasts.
Scroll down for illustrations that support the podcast.
Note - playing the podcast is not supported on Internet Explorer; please use any other browser, or listen on Spotify, Apple Podcasts, etc.
Podcast Illustrations
All images courtesy of Barbara Romanowicz

Tomography relies on “illuminating” inhomogeneities within the Earth using seismic waves from as many directions as possible. The time taken for a seismic wave to travel from its source, e.g., S1, which is usually an earthquake, to each receiver in a network of receivers (R1, R2,…) depends on the path it follows and its speed along that path. The speed of a seismic wave depends on the temperature of the material it is passing through - the hotter it is, the slower it travels. By measuring enough travel times, we can map the temperature inhomogeneities within the Earth.
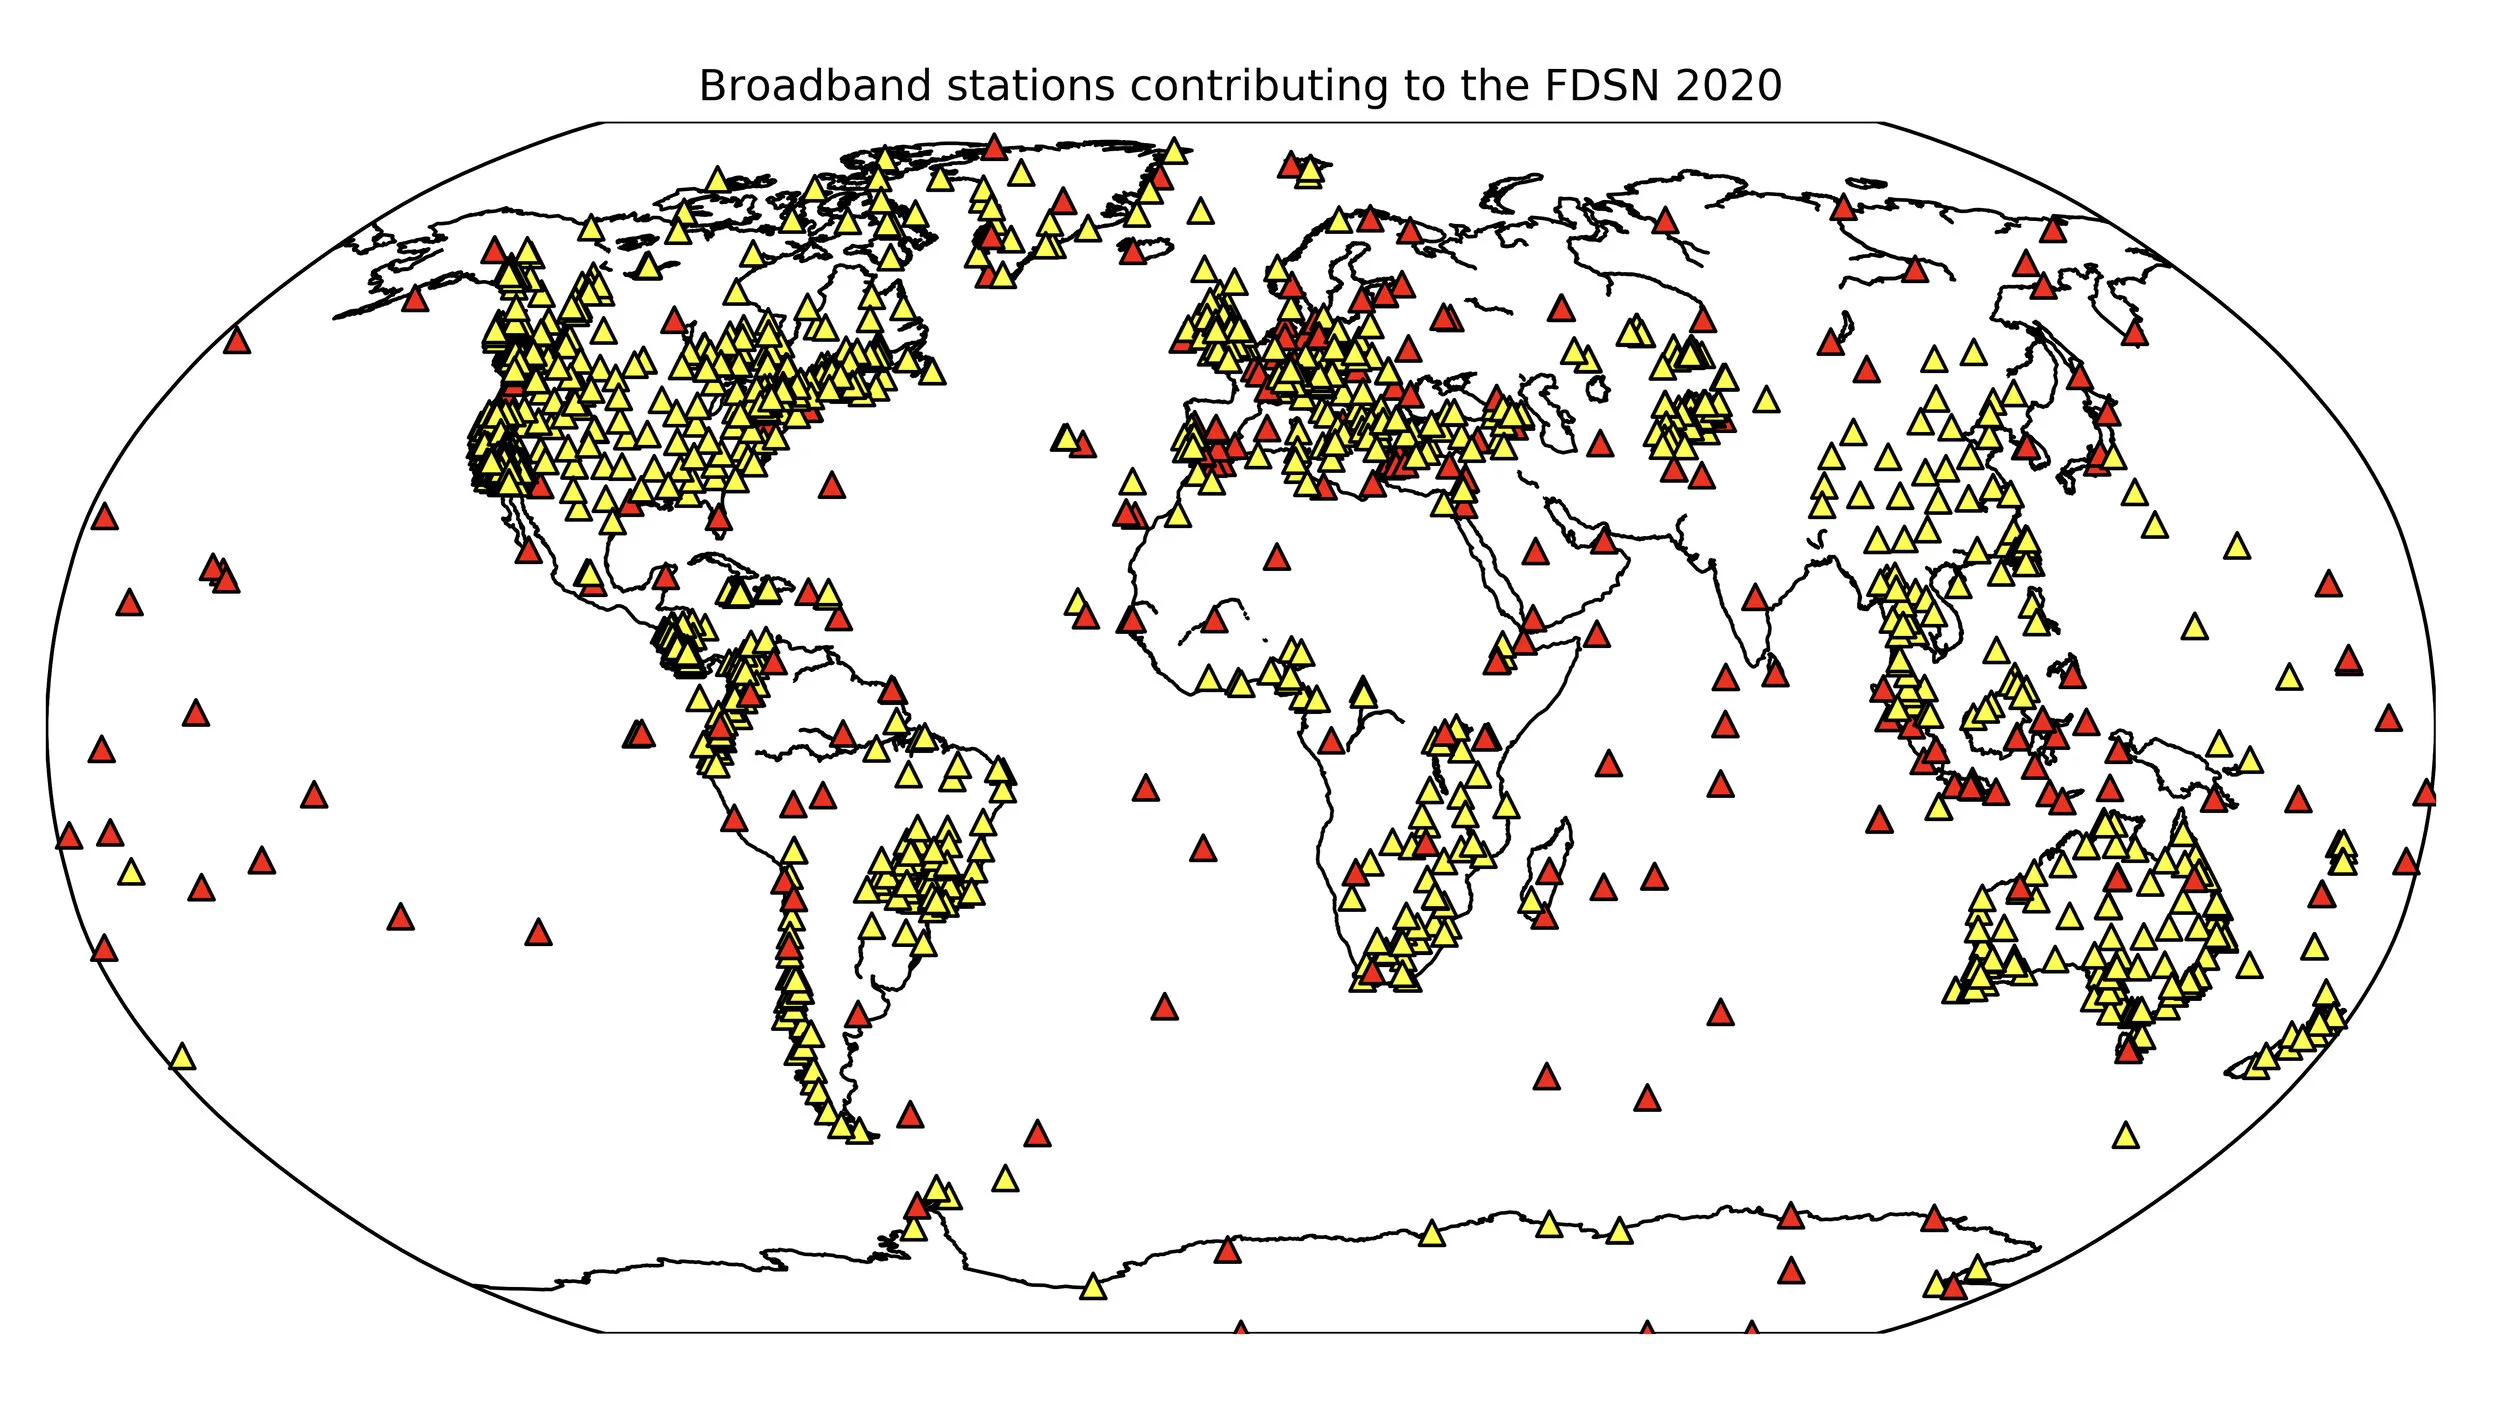
The seismic waves detected by this network of seismic stations are used to synthesize tomographic images of the Earth’s mantle, such as those shown below.

Japan
Section under Japan using two different models showing seismic wave velocity, which is an indicator of temperature with fast velocities being colder. The black lines indicate depths of 400, 600, and 1,000 km. The subducting slab of the Pacific plate is clearly visible. The sinking of the slab appears to stagnate at a depth of 660 km.

Tonga
The seismic wave velocity section also shows a subducting slab beneath Tonga, which appears to stagnate at a depth of about 1,000 km.

Cross-sections through the whole mantle along the plane indicated at right for two different models. The colors indicate shear wave velocities, with low velocity regions (blue) indicating cooler regions and high velocity regions (red) indicating hotter regions. Both models show a broad plume of hot material below Samoa and Hawaii (which is off-path). The locations of major hot spots are shown as green circles.

Cross-sections through the whole mantle for the same two models used for the figure above for the section shown at left. Hot plumes that appear to extend to the core-mantle boundary are revealed by both models below Cape Verde and Darfur.
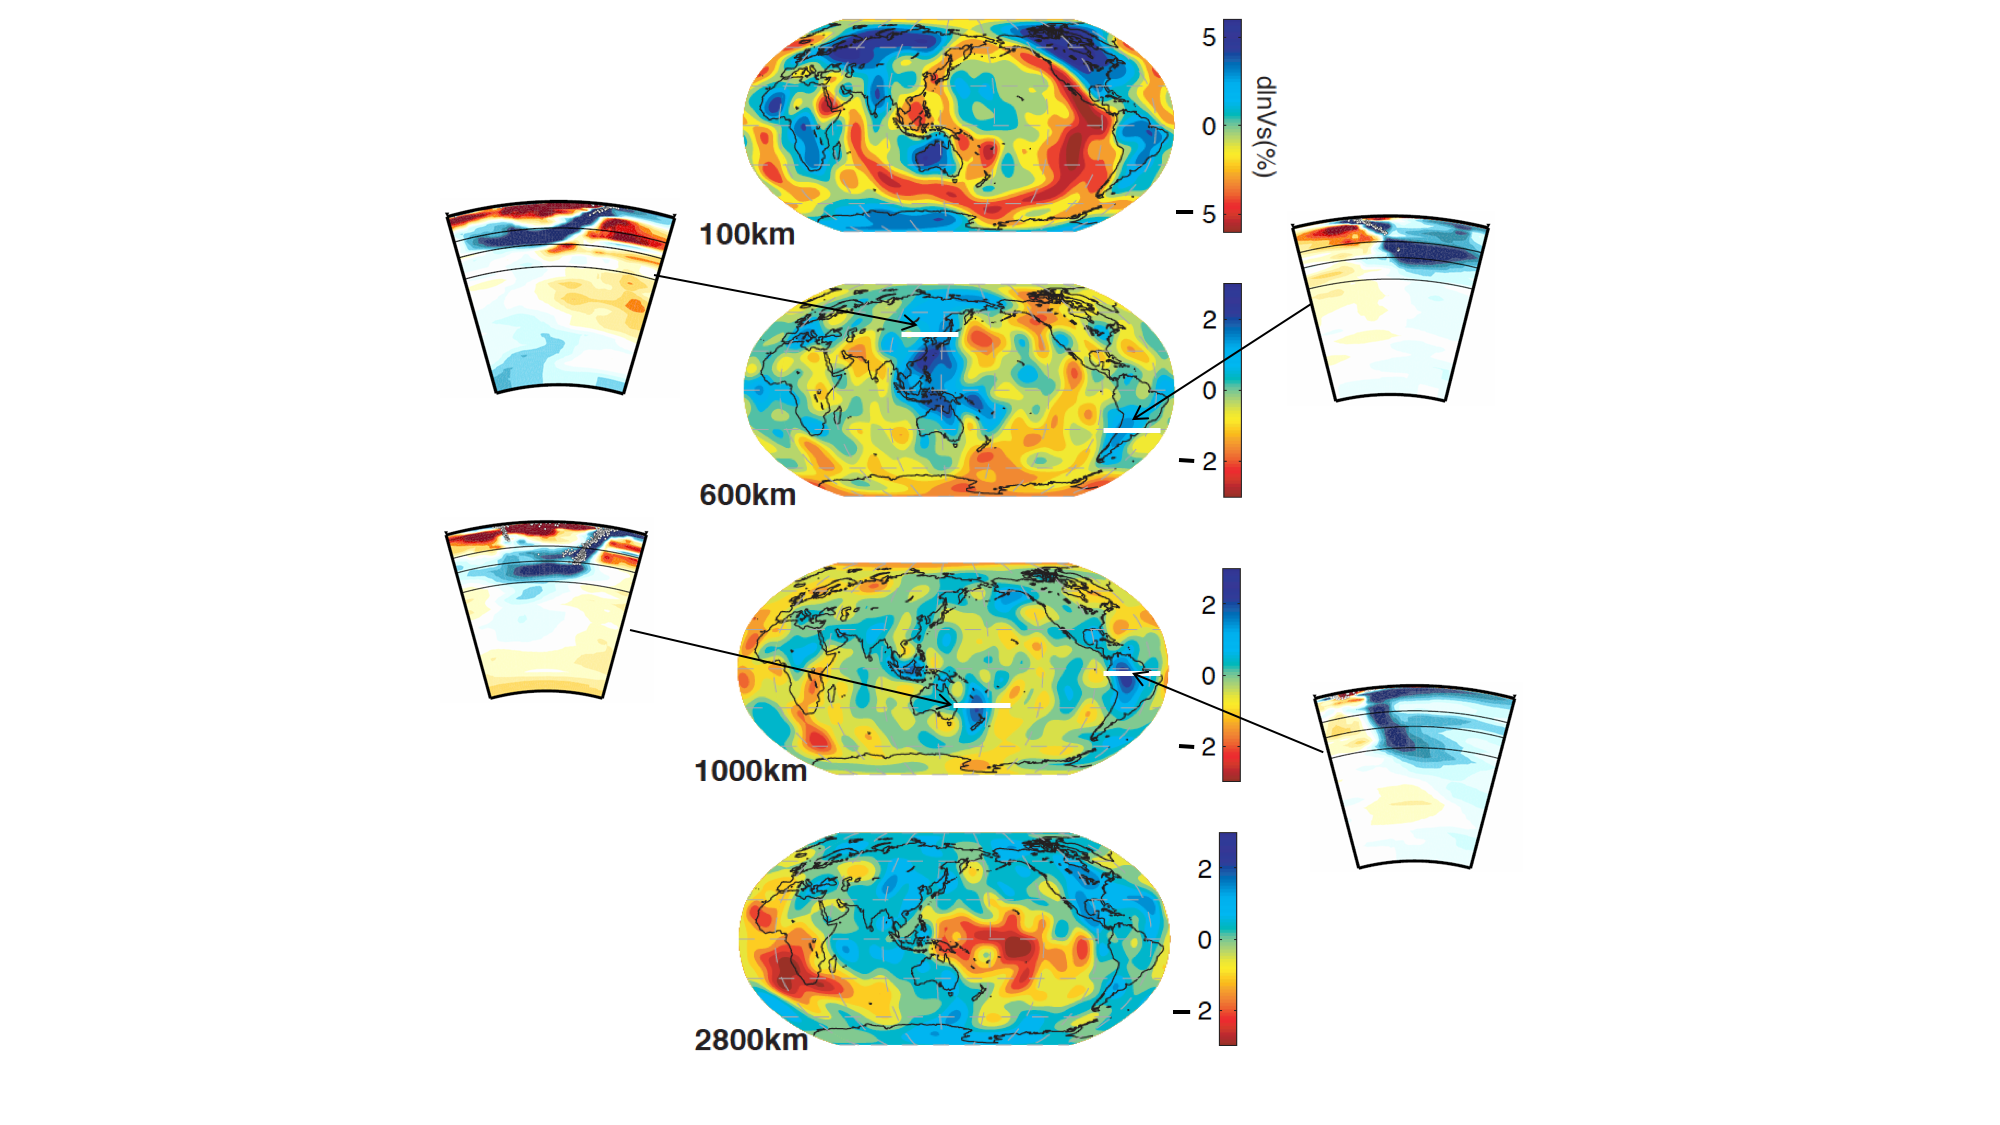
Shear wave velocity maps at four different depths. The cross sections are keyed into their locations on the map at the depth where each of the subduction zones is most pronounced. Thus, the top left section, which cuts through Japan, is keyed to the 600 km depth map where the cold material of the stalled slab shown in the section shows up most clearly. Similarly, the more recently subducted material along the southwest coast of S. America is keyed to the 600 km depth map, while the material subducted longer ago, which has had time to sink further, below central S. America, is keyed to the 1000 km depth map.