
Bruce Levell on Bias in the Sedimentary Record

How can we tell if the sedimentary record is good enough to make solid inferences about the geological past?
Bruce Levell tackles this question by combining fieldwork with systematic analysis based on what we know about contemporary deposition and erosion. Armed with an understanding of preservational bias, he questions the confidence with which some widely held interpretations of the sedimentary record have been made. For example, by analyzing sequences of glacially-deposited rocks in southwest Scotland, he has shown with others that, contrary to the “Hard Snowball Earth” hypothesis, parts of the Earth probably experienced a persistently active hydrological cycle and were not simply fully-frozen, at least during the earlier of the two postulated snowball glaciations.
Bruce Levell is a Visiting professor in the Department of Earth Sciences at the University of Oxford. Previously, he was Chief Scientist for Geology at Royal Dutch Shell.
Podcast Illustrations
Images coutesy of Bruce Levell unless otherwise noted.

Siccar Point, Berwickshire, Scotland, UK
The unconformity that James Hutton recognized as a gap in the geological record in 1788. The person is standing on shallowly-dipping Devonian sandstones that rest unconformably on steeply-dipping marine Silurian greywacke sandstones. Across the unconformity, about 80 million years of Earth history are missing from the record. Gaps in the record are rarely so easy to discern.
Photo: Colin MacFadyen/NatureScot

How Accumulation of Sedimentation Varies with Time Interval
In the podcast, Bruce Levell describes this plot, which shows the decrease in the accumulation rate of sediments with increasing duration of the time over which the rate is measured. He explains how this relationship shows us that there are increasing gaps in the record caused by removal of sediment by a “preservation filter” of progressively increasing severity with time. Thus, for example, on the timescale of a day, we might have a flood deposit from a river in spate, but if we average over a year (1a), the period includes times when the flood deposit is partially or fully eroded, or when there is no deposition. The graph also shows that the filter operates from timescales of minutes to hundreds of millions of years.
The color-coded bar below the graph shows durations of the various sedimentary and stratigraphic processes that affect the record.
Sadler, P.M, & Jerolmack, D.J (2014), Geol. Soc. London Special Publication 401(1)
Interpreting Beds in a Turbidite

The diagram shows how the broad family of underwater density current deposits is formed. It varies from turbidity currents at bottom (forming high-density turbidites HDT and low-density turbidites LDT) to debris flows (top). The image below shows a section of a sandstone formed by turbidity currents. These currents accompany underwater “landslides” and are common in deep marine environments on the edge of continental shelves but can also occur in lakes and coastal environments.
Peter Haughton

Part of a sandstone cliff in Cornwall, UK, that was deposited by turbidity currents on the seafloor at the edge of a continental shelf. Counting from the bottom, there are two sets of five beds, each successively thinning (i.e., containing finer grains) upwards. It is tempting to relate these sets of beds to either a single event with pulsatory but declining flows or a series of very closely-related events during which the sediment volumes delivered to this point successively decreased accompanied by a reduction in current speed. One could interpret this deterministically under the assumption that thickness is related to volume as decreasing volumes of sediment liberated by successive underwater slumps retreating away from this point, or as overflowing of a levee system by successively weaker pulses of turbidity currents flowing along a channel. But successions of five successively thinner beds might also happen by chance. Determining which of these and other plausible hypotheses are true depends largely on the wider context. The image shows about 60 cm of the section from top to bottom.
Astronomical Tuning

A. Cliffs on the south coast of Sicily consisting of limestones and marls (which are richer in clay). The regular banding in the cliffs corresponds to the proportions of carbonate and clay in the beds, with lighter colors being carbonate-rich limestones, and grey and beige being clay-rich marls. The entire section was deposited in deep water with abundant planktonic foraminifera. Four beds are labeled by their assigned number (36, 42, 56, and 69), and ages of two of the beds are indicated in millions of years (Ma).
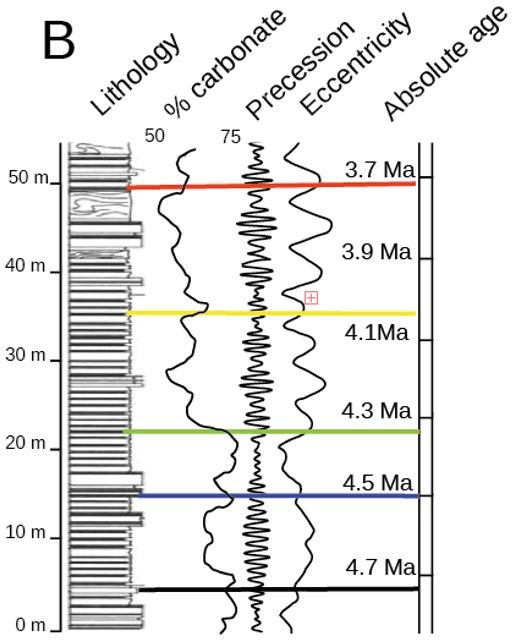
B. Graphs with age varying from 4.8 million years ago (Ma) at the bottom to 3.6 Ma at the top. The scale of the sedimentary log at left shows thickness (m) from the bottom of the cliff. The percentage carbonate in the rock is shown, increasing left to right from 50% to 75%. The precession and eccentricity curves show the time-synchronized variations in orbital parameters of the Earth. The ~5-meter-thick cyclic variations of the carbonate content are correlated to the 400,000-year eccentricity cycles. This variation is partly visible in the stepped profile of the cliff, with carbonate-rich limestone beds being more erosion-resistant than clay-rich marls and therefore forming protruding steps. The smaller-scale cyclical alterations of marls between grey, white and beige, and white are correlated to the 20,000-year precession cycles. The color changes reflect the variations in the amount of carbonate from plankton skeletons that accumulated on the seafloor. This is thought to have depended on the response of the plankton population to changes in water temperature and/or seasonality resulting from the precession.
Langerei,s C.G & Hilgren, F.J. (1991), Earth & Planetary Science Letters 104, 211
Gaps in the Sedimentary Record

A: Coastal cliff at Lyme Regis, Dorset, UK. The cliff consists of early Jurassic limestones, marls, and mudstones that were deposited in a shallow tropical sea with very little input of sediment washed out from nearby shores. It was home to a thriving variety of marine life, including ammonites, ichthyosaurs, echinoids, molluscs and crustaceans. The cliff exposes a rhythmically bedded succession without obvious breaks .
B. A plot of the thicknesses of two successions (Lyme Regis and St. Audries Bay and Quantock’s Head, Somerset) covering the same period of geological time. The various points on the graph were obtained by correlating fossils between the two successions. The changing slopes of the graph reveal that the thinner Lyme Regis succession has several breaks in deposition (horizontal slopes) and that depositional rates differ between the two sections. There are no obvious indications of this in the rock composition or fossil content. The “Angulata” zone is about 700,000 years in duration and was tied to the absolute time scale indirectly via correlation with dated volcanic rocks in Peru.
Diagram from Weedon, G. P. et al. (2018), Geological Magazine, 156, 1469
Effect of Subsequent Events on Preservation

These X-ray images of small-scale core samples of the Eel River shelf, California, illustrate how preservation of a particular river flood deposit in shallow marine settings can depend simply on what happened next. The colors are false color representations of X-ray “density,” which reflects grain size. Panels A-C document the destruction of a 3 cm-thick bed (green) deposited in January 1997 (A) over the ensuing 10 (B) and 15 (C) months. Burrowing animals rendered the bed unrecognizable by mixing up the sedimentary layer with background shallow marine muds, hence the swirls and thin streaks seen in B and especially in C.
By contrast, panels D-F show the persistence of a 5 cm-thick bed shown in D (green) formed in January 1995 over the ensuing 14 (E) and 55 (F) months. In E and F, the bed (lowest green and red layers) was buried to a depth of about 14 cm by a 14 cm-thick layer deposited on top of it by the March 1995 flood. This placed it below the depth inhabited by burrowing animals and also protected it from subsequent erosion.
Scale bar at left = 2 cm. Horizontal and vertical scales are the same.
Wheatcroft, R.A. & Drake, D.E (2003), Marine Geology 199, 123

An example of a faithful preservation of a few minutes or hours of activity. The surface shows 1 billion-year-old wave ripples formed by waves in shallow water. On their flanks are little terraces (white arrows) that record lower water levels in the troughs between the ripples when the ripple crests emerged from the water. Survival of these delicate features depended on what happened next. In this case, it was deposition of a millimetres-thick mud drape that shielded the little terraces from immediate erosion, and then the chance avoidance of a whole host of potentially erosional subsequent events. Cailleach Head, Western Scotland, UK.
Dynamics of Migrating River Channels
This time-lapse video illustrates the interplay between river channel migration, erosion, and deposition. As the river channel migrates laterally, it removes material at the same topographic level as its channel and replaces those sediments with a ribbon (meander belt) of river sand that is much wider than the channel itself.
Geo de Graf, Landsat, and Google Earth
River Deltas
Time-lapse sequence of satellite images of the estuary of the Atchafalaya River, Louisiana, USA, showing multiple cycles of deposition and removal of sediment, especially in the bar crossing the mouth of the river. Subsequent events or rapid subsidence are required in order for “tentatively” deposited sediments to survive in the geological record. The image covers a region about 30 km across.
NASA Earth Observatory, WGBH Educational Foundation
Selective Preservation on Coasts
Time-lapse satellite imagery from Landsat and Copernicus showing the island of Monomoy just off Cape Cod, Massachusetts, USA. It shows what is removed and what remains over a time scale of a few decades.
NASA/Landsat, and Google Earth
Re-Interpreting a “Snowball Earth” Deposit in SW Scotland

A. Sand-filled polygonal cracks on the top surface of a glacial tillite bed. The cracks were probably formed by frost wedges expanding and contracting. B. Pebbles on top of a poorly sorted deposit showing a frost-cracked stone whose two parts still lie next to each other. Both of these features imply exposure of the surface to the fluctuating temperatures of the atmosphere during the period ascribed to the global Sturtian glaciation (c. 717 to 660 Ma). The excellent preservation also suggests little or no re-working by water after deposition in a cold but arid setting. These observations are inconsistent with a world completely covered by thick ice.
