
Dan Rothman on Thresholds of Catastrophe in the Earth System
Listen to the podcast here, or wherever you get your podcasts.

Dan Rothman’s current research aims to understand the dynamics of the Earth’s carbon cycle. As he discusses in the podcast, he thinks there is strong evidence in the sedimentary record that major disruptions in the carbon cycle throughout the Phanerozoic reflect a characteristic flux of carbon into the system. This characteristic flux holds over two orders of magnitude of variation in the duration of the observed disruptions. By interpreting this flux as an upper bound of a critical rate set by the intrinsic dynamics of the Earth’s carbon cycle, he derives a critical mass of carbon that, when injected into the system, causes a disruption. A disruption in the carbon cycle is coincident with each of the major extinctions. He shows that the mass of anthropogenic carbon emissions forecast by the end of the century is about the same as the mass of carbon dioxide outgassed by the massive volcanism that generated the portion of the Deccan Traps deposited just before the end-Cretaceous extinction.
Dan Rothman is Professor of Geophysics at the Massachusetts Institute of Technology.
Photo courtesy of John Hayes
Podcast Illustrations
Illustrations from Arnscheidt & C.W. & Rothman, D.H. (2022), Annual Review of Marine Science 14, 49, unless otherwise noted.
The Carbon Cycle

Key fluxes in the carbon cycle. Fueled by solar energy, plankton and plants use photosynthesis to convert carbon dioxide to organic carbon in the form of carbohydrates. Further up the food chain, other organisms use organic carbon as an energy source, converting it back to inorganic CO₂ via the process of respiration. The diagram shows the partitioning into organic (green) and inorganic (black) reservoirs of carbon. Since photosynthesis favors the lighter isotope of carbon (¹²C), the amount of the heavier isotope (¹³C) is depleted in organic carbon with respect to the planetary average. The amount of depletion is expressed as a measure of how much the ratio of the two isotopes departs from the planetary average in parts per thousand (δ¹³C).

The global biogeochemical cycling of calcium carbonate.
(a) Modes of calcium carbonate transformation and recycling within the surface system and loss to the geological reservoir. 1. Precipitation of calcite by coccolithophores and foraminifera. 2. Carbonate reaching deep-sea sediments dissolves if the bottom water under-saturated and/or the organic matter flux to the sediments is sufficiently high. 3. Precipitation of calcium carbonate by corals and shelly animals. 4. Precipitation of calcium carbonate results in higher CO₂ at the surface, driving a net transfer of CO₂ from the ocean to the atmosphere.
(b) Modes of calcium carbonate transformation and recycling with the geological reservoirs and return to the surface system. 5. Calcium carbonate laid down in shallow seas as platform and reef carbonates and chalks can be uplifted and exposed to erosion through rifting and mountain-building episodes. Calcium carbonate can then be directly recycled through combination with water and carbon dioxide to calcium and bicarbonate ions. 6. Thermal breakdown of carbonates subducted into the mantle or deeply buried. The decarbonation reaction is essentially the reverse of silicate weathering, and results in the creation of calcium silicates and the release of CO₂. 7. Weathering of silicate rocks in which calcium silicate combines with water and CO₂ to produce calcium and bicarbonate ions and silica. 8. Emission to the atmosphere of CO₂ produced through decarbonation. This closes the carbon cycle on the very longest tmie-scales.
Ridgwell, R.E. et al. (2005), Earth and Planetary Science Letters 234, 299
The Carbon Isotope Record
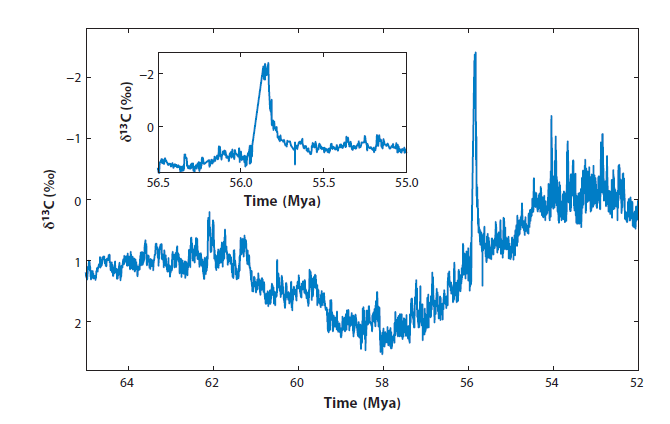
In the podcast, Dan Rothman describes the disruptions in the carbon cycle recorded in the ratios of stable carbon isotopes in carbonate rocks. He catalogued 31 such disruptions over the course of the Phanerozoic. The plot shows one of these events when ¹³C was depleted with respect to ¹²C during the Paleocene-Eocene Thermal Maximum (PETM), which occurred about 55.8 million years ago. The inset shows the abrupt onset and subsequent decay of the event in detail. The timescales of the events were obtained from deep-sea cores in the South Atlantic and in the Weddell Sea. The magnitude of the isotopic excursion (2.7 ± 1.1‰) was obtained from analyses of PETM carbonates formed from the skeletons of foraminifera. Note that the δ¹³C scale is inverted, with δ¹³C values being increasingly negative along the positive y direction.
Extinction Record
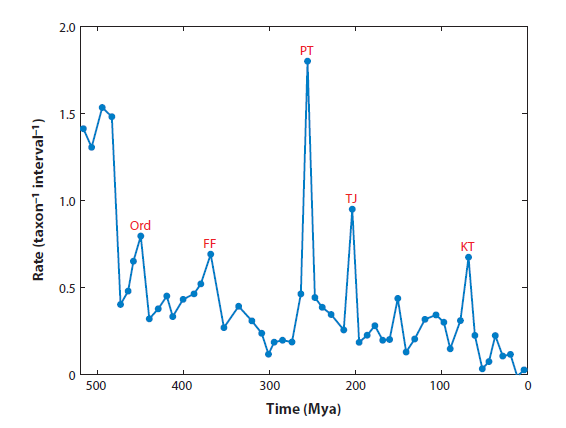
Extinction rates for marine animals during the Phanerozoic. The “Big Five” extinctions are labeled: end-Ordovician (Ord), Frasnian-Famennian (FF), end-Permian (PT), end-Triassic (TJ), and end-Cretaceous (KT).
Size vs. Duration of Carbon Disruptions
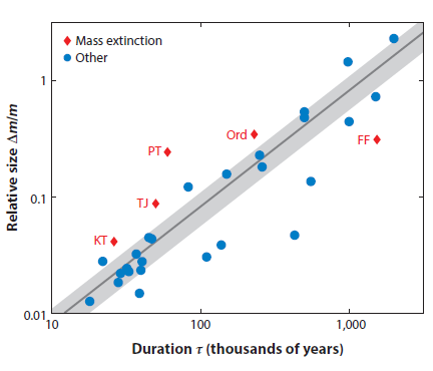
This is the key plot discussed by Dan Rothman in the podcast. It shows the relative sizes (m = mass of carbon) versus the durations of 31 disruptions of the carbon cycle during the Phanerozoic. The red dots mark the disruptions corresponding to the five major mass extinctions (see figure above), while the blue dots represent disruptions that were not associated with unusually high rates of extinction. The straight line denotes a characteristic rate of change of the carbon in the Earth system. Most of the events fall near the line (gray region), while four of the five events corresponding to the major mass extinctions fall above the line. The fifth mass extinction, in the late Devonian at the Frasnian-Famennian boundary, is clearly different, lying in the slow region below the line. Some researchers have suggested that the Frasnian-Famennian event is not an extinction event but instead represents a decrease in the rate at which new species originate.
Rothman, D.H. (2017), Science Advances, 3:e1700906
Injected Carbon: Critical Masses and Critical Rates

(a) Thresholds for mass extinction expressed in terms of a critical mass Mc of carbon at timescales short compared to the principal damping timescale τ (left side of plot) and at timescales longer than the damping timescale (right side of plot). At longer timescales, the Earth system damps an injection of carbon, and so the amount of carbon that can be absorbed before the system becomes critical is proportional to the duration of the carbon-injection event. At short timescales, the carbon injection is akin to an impulse, or delta function, and the Earth system undergoes an excursion when more than a constant critical mass is injected. (b) In this plot, the critical mass is converted into a critical rate of change of carbon. For short timescales, the rate is proportional to 1/T, whereas for long timescales, the rate is constant and corresponds to the straight line in the figure above.
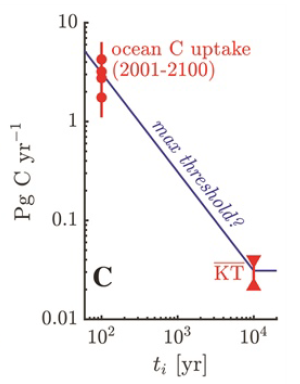
Comparison of perturbations of the modern and the end-Cretaceous (KT) carbon disruptions with Dan Rothman’s hypothesis for the upper bound of the threshold for excitation of the Earth’s carbon cycle (left part of figure (b) above). The dots correspond to four different estimates for the amount of anthropogenic emissions through the end of the present century. The size of the end-Cretaceous carbon injection is an estimate of the amount of CO₂ outgassed by massive volcanism over a few tens of thousands of years just before the mass extinction (which included the demise of the dinosaurs). Since the excitation threshold scales with the inverse of the event duration, both the modern and ancient perturbations are equivalently near it, even though the end-Cretaceous carbon injection was 100 times larger than the modern one.
Rothman, D.H (2019), SIAM News 52, 9
The Deccan Traps

The Deccan traps are extensive thick sequences of lava that were erupted at the close of the Cretaceous. While the Chixclub meteor impact is widely thought to be the direct cause of the extinction, some researchers, including Dan Rothman, hypothesize that the disruption of the carbon cycle caused by the outgassing of CO₂ during this prolific series of eruptions contributed to the environmental change associated with the end-Cretaceous mass extinction.
Courtesy of Courtney Sprain
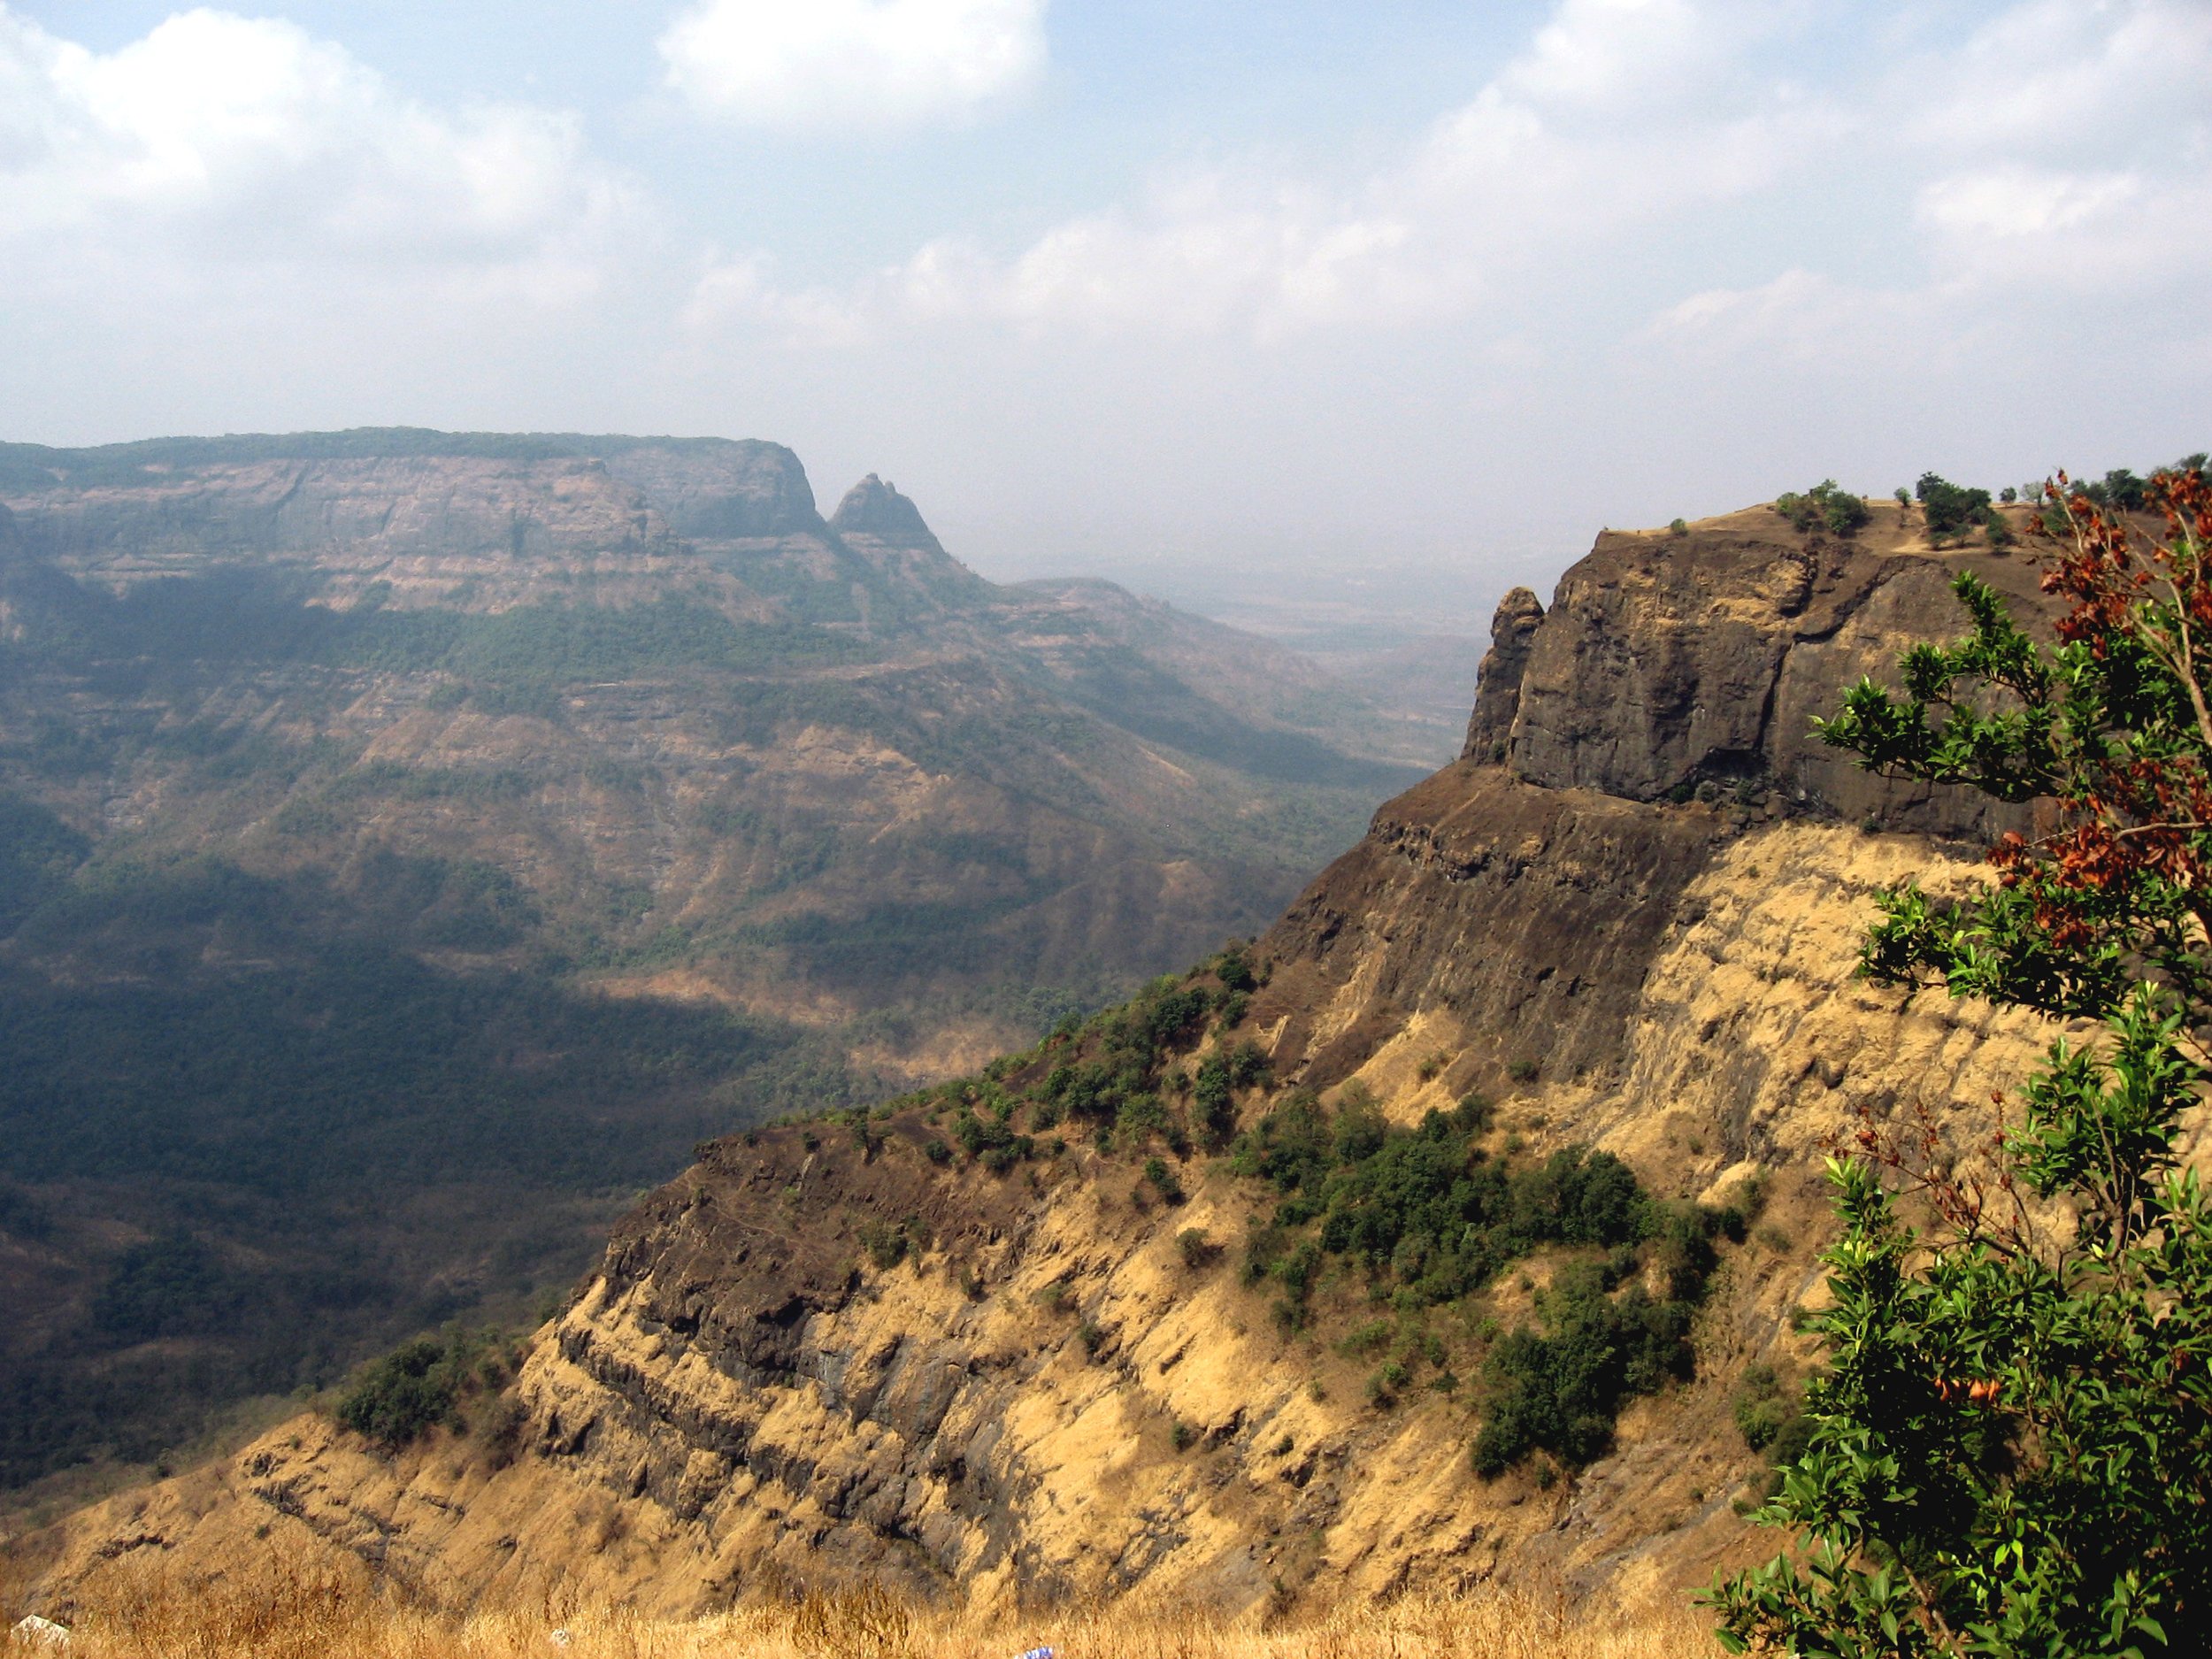
Eroded hills of the northern Western Ghats in Maharashtra, India, composed of end-Cretaceous basaltic lavas. Periods of massive volcanism generate flood basalts which form today’s large igneous provinces.
Courtesy of Nichalp
Further Reading
Ridgwell, R.E. & Zeebe, R.E. (2005), Earth and Planetary Science Letters 234, 299
Rothman, D.H. (2017), Thresholds of Catastrophe in the Earth System, Science Advances 3:e1700906
Rothman, D.H. (2019), Characteristic Disruptions of an Excitable Carbon Cycle, PNAS 116, 14813
Rothman, D.H. (2019), Carbon Cycle Catastrophes: A Dynamical Systems Perspective, SIAM News 52, 9
Arnscheidt, C.W. & Rothman, D.H. (2022), The Balance of Nature: A Global Marine Perspective, Annual Review of Marine Science 14:49