
David Evans on Supercontinents

David Evans is Professor of Earth and Planetary Sciences at Yale University. He uses magnetic fields frozen into rocks when they formed to deduce where they were and, together with uranium-lead dating, to reconstruct the supercontinents that assembled about every 600 million years over most of Earth history.
Courtesy of Page Burt
Listen to the podcast here or wherever you listen to podcasts.
Scroll down for illustrations that support the podcast. And add your comments at the bottom of the page.
Note - playing the podcast is not supported on Internet Explorer; please use any other browser, or listen on Spotify, Apple Podcasts, etc.
Podcast Illustrations
Source citations are listed at the bottom of this page.
Images courtesy of David Evans unless otherwise noted.

Timeline of the supercontinents in millions of years ago (Ma). Black lines represent rift zones associated with supercontinental breakup. Red stars in the Superia supercraton (lower right inset) indicate possible mantle plume focal points of radiating swarms of mafic dykes.
Evans et al., 2016

Crystals of baddeleyite (zirconium oxide) occur in the basalt dyke swarms that form when a supercontinent breaks up. Just as with zircon, these crystals trap uranium in their crystal lattice, and can therefore be used to obtain accurate ages of such swarms. Since zircons are generally absent from mafic rocks such as basalt, the advent of baddeleyite dating opened up a powerful new geochronological tool. The crystals shown here are about 3 cm long - much larger than most crystals used for dating.
Courtesy of e-rocks

Although the magnetic poles wander, over the long term the Earth’s magnetic field is aligned with the geographic poles. The field adheres approximately to a magnetic dipole. When a rock forms, the ambient magnetic field is frozen into it. If we can measure the angle of the magnetic field with respect to the horizontal, we can determine the latitude at which the rock formed.
Original source unknown
The Yale University Paleomagnetism Lab

The barrel-shaped object at right is a magnetometer, and the horizontal cylindrical-shaped object at left is a shielded oven for heating the rock samples during partial demagnetization. All of the instruments are housed within a shielded room that blocks out over 99 percent of the Earth's magnetic field, so that demagnetization of the rocks can be achieved in a magnetically neutral environment.
Movie of gray cylindrical paleomagnetic rock samples on the “sushi bar.” A vacuum system picks up one of the specimens, rotates the tray underneath to a hole, and then lowers the sample into the magnetometer’s measurement region (below the image).

Western China is one of David Evans’s field locations. The grey band of rock in the hillslope consists of layers of basalt that attest to the breakup of Rodinia.
Reconstruction of Ancient Continental Block Assemblies (Supercratons)

A hypothetical example shows how, among the various geological features that can be used to reconstruct an ancient supercraton, dyke swarms provide the most convincing evidence. (a) A hypothetical supercraton with various geological elements, just prior to breakup. A large igneous province (green) with flood basalts and associated dykes and sills is emplaced along the incipient rift. (b) Breakup of the supercraton has spawned two cratons (A and B). If the cratons are not too modified, as with present-day South America and Africa, they are easily fitted together again using the shape of their margins (P-R and PM), and the matching up of the LIP (P1), older sedimentary basins (P2), and ancient orogenic front or fold-thrust belts (P3). (c) The more general case in which further breakup and relative translation and rotation has occurred (Craton C) and craton margins have been modified, and differentially uplifted. Dykes related to the LIP, however, remain on all three cratons and precise age dating yields a critical clue that they might be part of a single event. Paleomagnetic data may yield additional geometrical clues (north arrows), and paleolatitudes. (d) Reconstruction of the original supercraton, based only on the matching of the dyke swarms.
Bleeker & Ernst, 2006

Reconstruction of the Superia supercraton before rifting and breakup of various blocks on its southern margin between 2,500 and 2,080 million years ago. The red star shows the initial location of a hotspot, 2,075 and 2,065 million years ago, and the other colored stars show the inferred location of the hotspot at the indicated time intervals.
Ernst & Bleeker, 2010
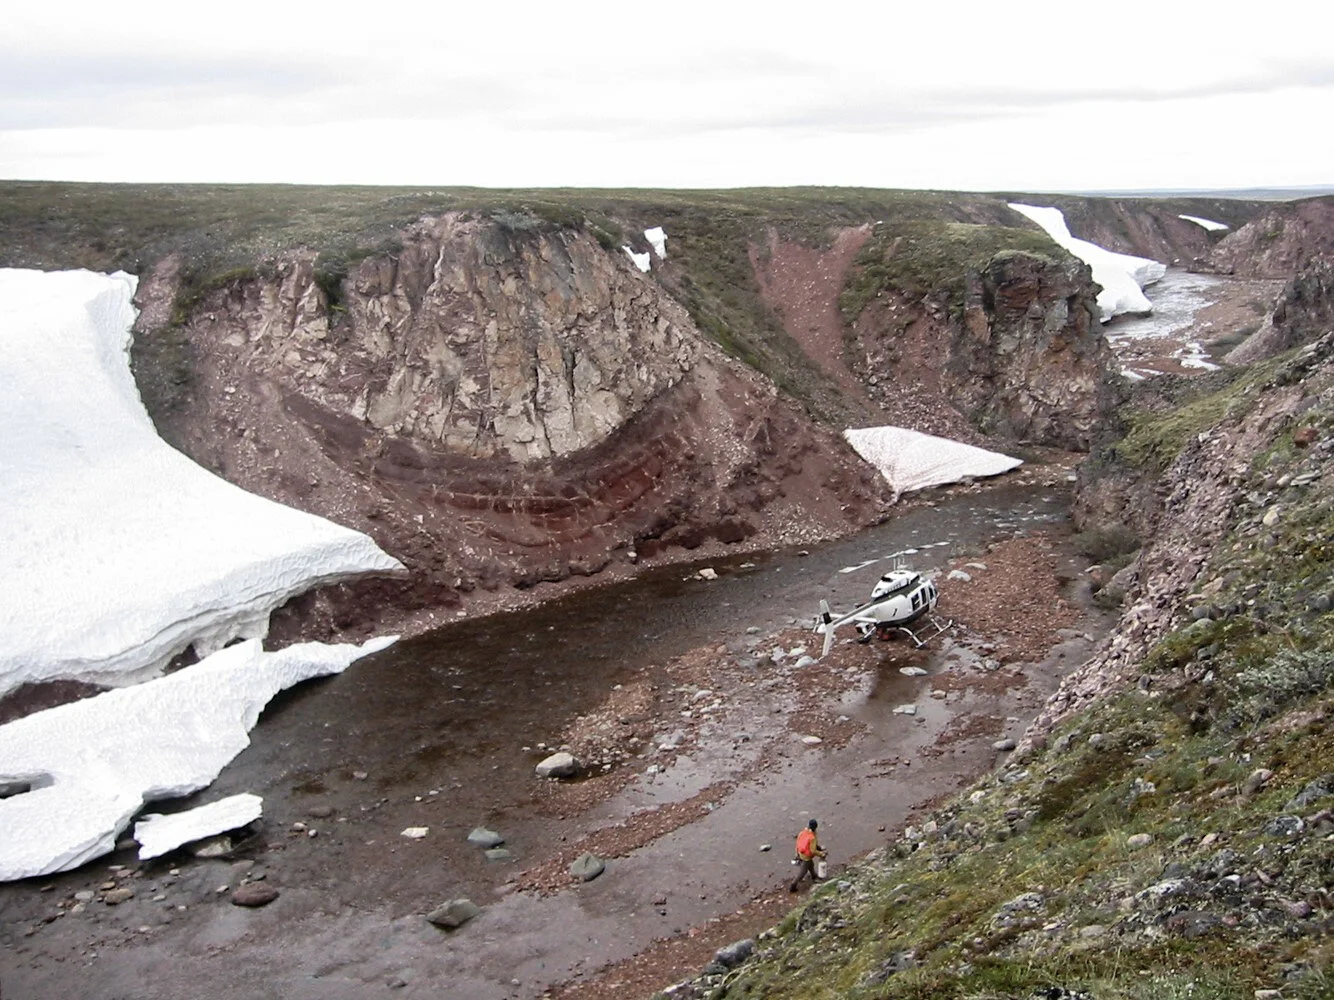
The great roadless barrenlands of Nunavut, central Canada, are one of David Evans’s field sites. The rocks he measures and samples there testify to the unification of Laurentia, the ancestral North American continent about 1,800 million years ago. Sites such as these are accessible only by helicopter.
Courtesy of Rob Rainbird/Theresa Raub
References
Bleeker, W. & Ernst, T., in Dyke Swarms-time Markers of Crustal Evolution, eds. Hanski et al., pub. A.A. Balkema, Rotterdam, 2006
Evans, D.A.D., Li, Z.X., & Murphy, J.B, Geol. Soc., London, Special Publications, 424, 1-14 (2016)
Ernst, T., Bleeker, W., Canadian Journal of Earth Sciences, 47, 5, 2010