
David Sandwell on Seeing Plate Tectonics Under the Oceans

David Sandwell is a Professor at Scripps Institution of Oceanography at the University of California San Diego. He has been a leader in using satellite measurements to map the sea floor, which has given us our first global sea-floor map.
David Sandwell deploying a GPS receiver in Baja, Mexico.
Courtesy of David Sandwell
Listen to the podcast here, or wherever you get your podcasts.
Scroll down for illustrations that support the podcast.
Note - playing the podcast is not supported on Internet Explorer; please use any other browser, or listen on Spotify, Apple Podcasts, etc.
Podcast Illustrations

The European Space Agency’s CryoSat-2 satellite. Though its main purpose is to use radar altimetry to map polar ice, the altimetry measurements are conducted throughout its orbit, providing high-quality sea-surface data for the bathymetry mapping described in this podcast.
Courtesy of EADS Astrium

The satellite measures distance to the sea surface by timing the round-trip travel time of radar pulses emitted by the satellite. The results are beamed down to a ground station. The diagram shows in exaggerated form how the extra gravity from a mountain on the sea floor piles up the water above it to produce a corresponding bump on the surface. In reality, the surface bump is about 10,000 times smaller than the sea-floor bump. Thus, a seamount 1 km high produces a surface bump of about 10 cm.
Courtesy of Scripps Institution of Oceanography

The effect of sea-floor features on the gravity at the sea surface for three different ocean depths. It shows that the two seamounts are smeared into a single gravity anomaly when the sea is 4 km deep, but they are resolved into two peaks if the depth is 3 km or less.
Courtesy of Scripps Institution of Oceanography

In contrast to the bathymetry from satellite altimetry (contours), the measurements from ship-borne sonar cover a much smaller area, but at a resolution of 100 meters, i.e., about 40 times sharper than the satellite map. Ship captain Chris Curl and researcher JJ Becker aboard R/V Melville crossing over Discovery Seamounts in the South Atlantic ocean.
Courtesy of Scripps Institution of Oceanography

Diagram illustrating sea floor spreading along mid-ocean ridges. The ridges are displaced sideways at transform faults. Stretching away from the ridge are fracture zones that record the spreading of the sea floor. Abyssal hills form parallel to the ridge axis. The plate motions are driven by the pull of the cold and dense subducting lithosphere.

Global bathymetry map obtained from satellite altimetry and ship depth soundings. The red dots show the locations of major earthquakes. The sea-floor spreading ridges and transform faults and fracture zones perpendicular to them are clearly visible. Many of the major features in the the southern oceans were largely unknown prior to mapping from satellite altimetry. This includes the Louisville Ridge and Foundation Seamounts in the South Pacific, and the ridge transform structure of all the southern hemisphere spreading ridges. Today, data from CryoSat-2 are revealing previously unmapped seamounts, microplates, and abyssal hills on the older sea floor away from the spreading ridges.
Courtesy of Scripps Institution of Oceanography

The satellite altimetry produced the contour map, which reveals the approximate location of the seamounts. These are used to guide a ship-borne survey to the locations marked by the red dots to obtain actual depth measurements to calibrate the altimetry data, and to map out the seamount summits in detail. The uncharted seamounts marked by red dots are predicted to rise more than 3,000 m from the surrounding sea floor.
Courtesy of Scripps Institution of Oceanography

The altimetry-derived bathymetry uncovered a microplate (labelled MP in the images) in the Indian Ocean. The microplate is about 150 km across. The areas of chaotic sea floor are thought to be caused by large changes in spreading direction associated with the collision between India and Asia about 50 million years ago.
Courtesy of Scripps Institution of Oceanography
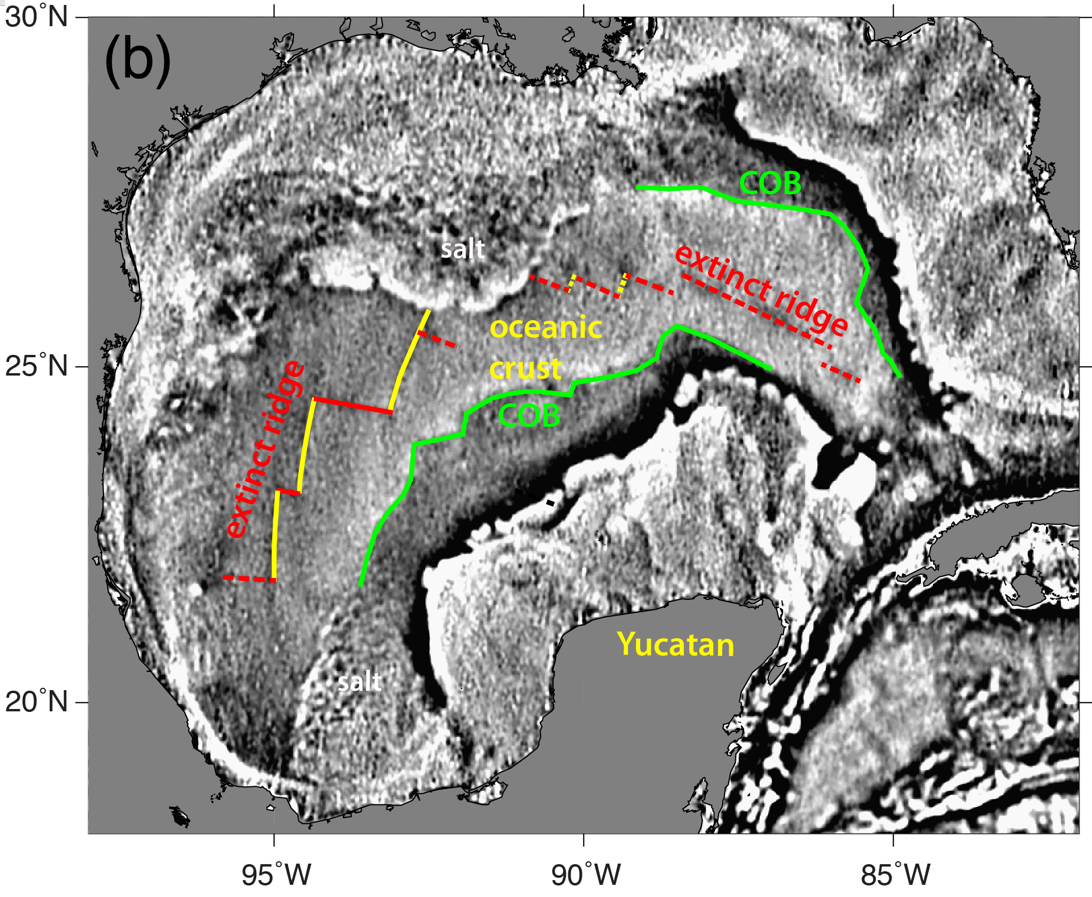
The sea floor in the Gulf of Mexico basin is very flat because the original topography is covered by thick sediment (6-12 km). The density contrast between the base of the sediments and the original topography produces gravity anomalies associated with the extinct sea-floor spreading ridge and the continent-ocean boundary (COB). The exact location of the extinct ridge was unknown prior to the mapping by CryoSat-2.
Courtesy of Scripps Institution of Oceanography

When a transform fault, which manifests as a sideways displacement of a spreading ridge, propagates along the ridge, it leaves behind a diagonal shear zone and a pseudofault - analogous to the wake of a boat. The sheared zone is crust that formed on the right plate, was sheared by the moving transform fault, and deposited on the left plate. The pseudofault is an age offset on the right plate and has the characteristics of a standard fracture zone. When a propagating transform fault reverses direction, it creates a zig-zag pattern. The satellite-derived global bathymetry map showed that such “see-saw” propagators are ubiquitous. What makes the transform faults propagate or reverse direction is not understood.
Courtesy of Scripps Institution of Oceanography

Gravity field of the mid-Atlantic ridge. The active spreading boundary (red) includes orthogonal ridges and transform faults. The straight fracture zones (yellow) record the opening direction of the Atlantic basin. The wiggly magenta lines are newly-discovered see-saw propagating transform ridges. The wiggles are symmetric about the spreading ridge, indicating that they formed as part of the sea-floor spreading process.
Courtesy of Scripps Institution of Oceanography