
Dietmar Müller on Reconstructing Plate Motions Over a Billion Years of Earth History

Dietmar Müller is Professor of Geophysics at the University of Sydney. He and his team built GPlates, a powerful software tool enabling researchers to synthesize diverse sets of geological data into a self-consistent reconstruction of the Earth’s tectonic history. In February 2021, his team published an animated billion-year plate reconstruction, which has had an enormous impact on the public.
Listen to the podcast here or wherever you listen to podcasts.
Scroll down for illustrations that support the podcast. And add your comments at the bottom of the page.
Note - playing the podcast is not supported on Internet Explorer; please use any other browser, or listen on Spotify, Apple Podcasts, etc.
Podcast Illustrations
All imagery courtesy of Dietmar Müller and the EarthByte Group

The main screen of GPlates showing plates and plate boundaries. Researchers all over the world use GPlates to reconstruct plate-tectonic positions, orientations, and motions through geological time in an interactive manner. The software also functions as a geographic information system and a way of visualizing image data. Geological, geophysical, and paleo-geographic data may be attached to the simulated plates, enabling researchers to trace the motions and interactions of these data through time.
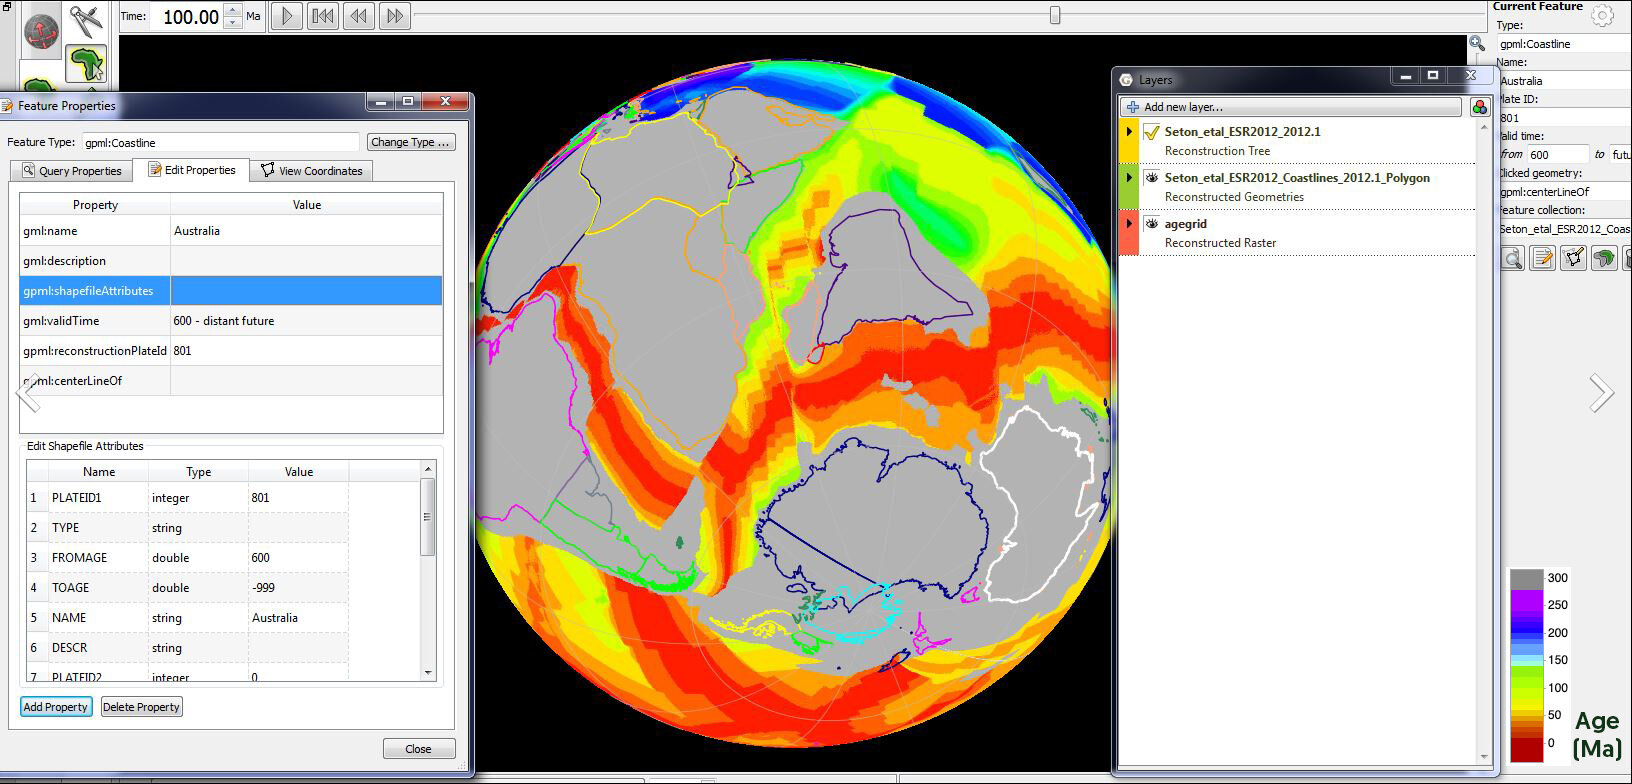
GPlates screenshot, with seafloor age data superposed onto the reconstructed oceanic plates.

A map of reconstructed plate locations 120 million years ago. The continents are shown in grey and white and the color shading indicates the seismic velocity of the mantle at a depth of 1,400 km obtained from seismic tomography. The seismic velocity is an indicator of mantle temperature, with the coldest regions suggesting the presence of subducted slabs of oceanic crust. Because it takes about 120 million years for a slab to sink to a depth of 1,400 km, and assuming the slabs sink vertically, the presence of these slabs are markers of active subduction zones in these locations 120 million years ago. This information serves as a constraint on valid tectonic reconstructions.
Courtesy of Grace Shephard (CEED/UiO)
The Billion-Year Plate Reconstruction

1000 Ma Snapshot: The distribution of continental crust, ocean basins, and plate boundaries used in the plate model at one billion years ago. Continental lithosphere is shown as tan, blue, and green.

500 Ma Snapshot: Selected abbreviations: A-C Avalonia-Cadomia; Af Afghanistan; B Baltica; C Congo; CM Central Mogolian Terrance; I India, S Siberia.

Present-day snapshot: distribution of continental crust, ocean basins, and plate boundaries used in the model.
This billion-year reconstruction combines data from over 500 different studies, many of which in turn are reviews of numerous further studies. The video appeared on the front page of national media, such as The New York Times, and has been viewed online over two million times. The video starts with the break-up of Rodinia about a billion years ago, and shows the assembly and subsequent breakup of Pangea between 330 and 175 million years ago. High slab subduction in the early Cretaceous, referred to as the “slab superflux” in the podcast, is manifest around the 130 million-year-ago mark with the presence of many active subduction zones. The video shows subduction zones that appear to jump from plate to plate; this is not an artifact, but reflects actual shut-down of subduction zones and initiation of new zones on adjacent plates.