
Geoff Abers on Subduction Zones and the Geological Water Cycle
Listen to the podcast here, or wherever you get your podcasts.
Scroll down for podcast illustrations.

Geoff Abers is Professor of Geological Sciences at Cornell University. His primary research interest is in understanding processes that drive the recycling of material within the Earth, mostly at subduction zones. He has set up dense arrays of seismographs to make seismic images of features as small as layering within subducted crust to beyond 100 km in depth. He is actively working around Mt. St. Helens, Washington, and along the Alaska margin.
In the image, he is installing a seismometer in Alaska to record the aftershocks of the 2021 magnitude-8.2 Chignik earthquake. The seismometer is in the ground at the end of the black cable.
Podcast Illustrations
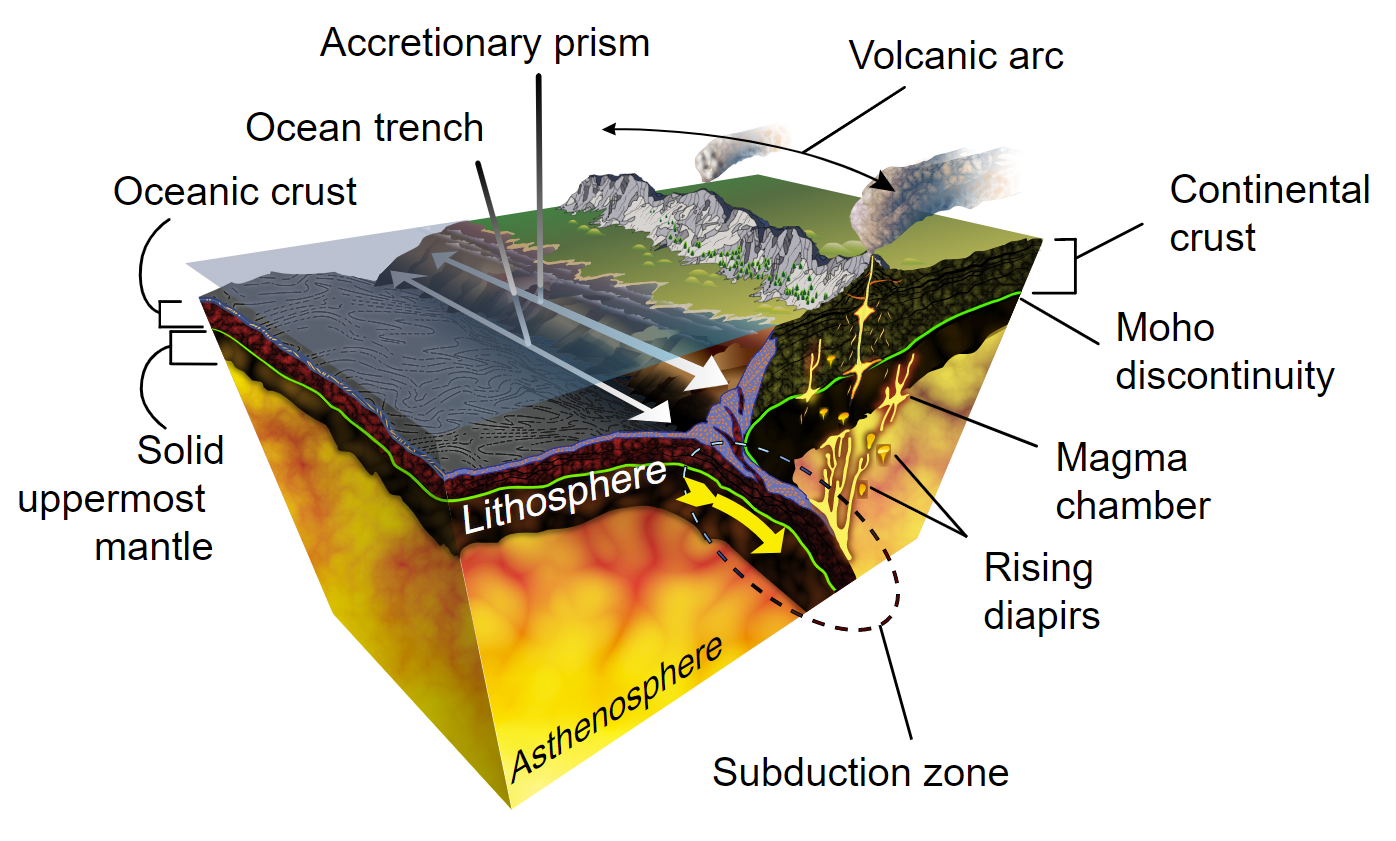
Diagram of a volcanic arc lying above a subduction zone. In most such arcs, the volcanos appear where the subducting plate has reached a depth of about 150 km.
Courtesy of Schroeder, K.D., from Wikimedia Commons under CC-BY-SA4.0

Diagram of a typical subduction zone at a continental margin, showing the crustal and upper mantle components and the processes that take place within them. As Geoff Abers describes in the podcast, water is released from the subducting lithosphere when the hydrous minerals break down. This is indicated as “fluid migration” in the diagram. The water rises into the mantle wedge where it lowers the melting temperature and causes partial melting. The melt rises and erupts from an arc of volcanos. The green circle indicates the location of earthquakes (episodic tremor and slip, ETS) that is observed in warm-slab subduction zones.
Wada, I., & Wang, K. (2009), Geochem. Geophys. Geosyst.,10, Q10009, doi:10.1029/2009GC002570

Geoff Abers and his colleagues made models of over 50 segments of subduction zones across the world. For each segment, they plugged in observed parameters, such as the convergence speed of the two plates and the age of the subducting plates. The trench segments, numbered from 1 to 56, are color-coded with a parameter (Φ) that is a measure of the thermal characteristics of the segment, from red (hot) to blue (cold). Φ (km) is defined as the product of the convergence speed (km/million years) and age (million years) of the subducting plate.
van Keken, P.E.B.R., et al. (2011) J. Geophys. Res., 116, B01401, doi:10.1029/2010JB007922

Geoff Abers refers to this figure as the Tokyo subway map. Each of the over 50 subduction zone segments shown in the map above is represented by a line that shows the predicted rate at which water is lost from the subducting slab as a function of depth. All the slabs lose a significant amount of water as soon as the slab gets into contact with the hot overlying mantle wedge, which is modeled to be a depth of 80 km. For many of the modeled slabs, such as Kamchatka and Calabria, further water loss is minor, as indicated by the vertical lines below 80 km depth. Other slabs, such as Chile, continue to lose water with increasing depth, mainly via dehydration of the uppermost mantle layer of the slab. A few slabs, such as the Marianas, are so cold that little water water is lost, even at a depth of 230 km.
van Keken, P.E., et al. (2018), Geosys., 2934

Sonar image of the sea floor off the shore of Alaska
The image looks east-northeast. The deepest sea-floor depths are shown in purple. The Aleutian trench runs along the left side of the image below the accretionary wedge, which is shown in green. In the podcast, Geoff Abers explains how water can penetrate the plate all the way down to the mantle via normal faults associated with the bending of the plate as it curves down into the trench. Such faults can be seen as dark lines running roughly parallel to the trench in the blue region on the right.
From Alaska Amphibious Community Seismic Experiment (AACSE) recovery cruise, 2019, R/V Marcus G. Langseth

In the podcast, Geoff Abers talks about using seismic imaging to track the fate of water in a subducting oceanic plate. Two examples of such images are shown here. Regions that appear red indicate slower seismic wave speeds, which reflect the presence of water. Left: image of the Pacific plate subducting below Alaska. Right: image of the Pacific plate subducting below the Cascade mountains on the northwest coast of the United States.
Rondenay, S., et al. (2008), Geology, 36, 275


A model of a subduction zone, showing the model’s predictions for temperature, metamorphic facies, and water content. The example illustrated here shows cross-section predictions for Central Honshu in Japan, in which the subducting slab is cold. At right: cross section of the predicted temperature profile. Below: cross sections of the predicted metamorphic facies and the predicted water content. The labels “80,” “100,” and “150” indicate locations where these depths (in km) are reached. The composition and the temperature of the slab strongly influence the metamorphic facies and therefore the water-carrying capacity. Cold slabs, such as the Central Honshu slab pictured here, can retain water to large depths, whereas warm slabs, such as Cascadia, dehydrate completely.
van Keken, P.E.., et al. (2011) J. Geophys. Res., 116, B01401, doi:10.1029/2010JB007922