
John Cottle on the Petrochronology Revolution
Listen to the podcast here, or wherever you get your podcasts.

John Cottle leads the team at the University of California, Santa Barbara, that launched a revolution in the field of igneous and metamorphic rock studies. As he explains in the podcast, the method his team developed involves splitting a stream of particles ablated from a rock or mineral sample by a laser beam. Each stream is ionized and enters its own mass spectrometer. One of them measures a radiometric age, and the other simultaneously measures the abundances of certain trace elements or isotopes. He describes how the split-stream method enabled his team to tease out the metamorphic histories of the Greater Himalayan Sequence and parts of Antarctica and New Zealand.
The photo shows him in the Miller Range, Antarctica.
Podcast Illustrations
Images courtesy of John Cottle unless otherwise noted.
Instrumental Setup for Laser-Ablation Split-Stream Inductively-Coupled-Plasma Mass Spectroscopy (LASS-ICP-MS)

Instrumentation setup for laser-ablation split-stream petrochronology. The laser is directed towards the sample being analyzed and causes fine particles of the sample to be ablated. The “sample out” stream is then split into two. One stream passes into a multi-collector inductively-coupled plasma (MC-ICP) mass spectrometer, and the other passes into a single-collector inductively-coupled plasma mass spectrometer (SC-ICP). The former instrument has superior isotopic ratio measurement capabilities and measures the uranium-thorium-lead ratios to obtain an age. The latter instrument is capable of rapid measurement over a large mass range and obtains the trace-element abundances.

Details of the instrumental setup for LASS-ICP-MS at UC Santa Barbara. At top left, the laser beam is directed onto the sample in a helium atmosphere. The ablated particles are flushed with argon gas, split into two streams, and passed into two different mass spectrometers. Upon entering a mass spectrometer, the particles are heated by inductive coupling to about 11,000°K when they become ionized and form a plasma (ICP). The Nu Plasma HR machine is a multi-collector MS and is used to measure U-Th-PB isotopes to obtain a radiometric age. The Agilent 7700x Quadruple machine is a single-collector MS and is used to determine trace-element abundances.

Photomicrograph of monazite crystals indicating 10-micron-diameter laser spot sizes. This resolution enables multiple analyses to be performed across a single crystal.
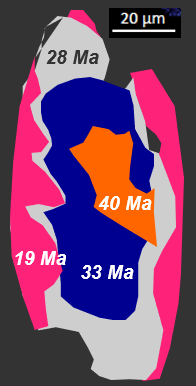
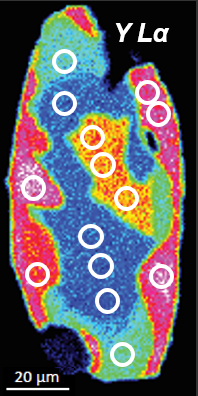
Images of a monazite crystal showing (R) the location where spot analyses were performed. The LASS analysis revealed that the crystal has several domains, each having a different age (L). The image at right was obtained using electron-probe microanalysis and shows the abundance of the trace elements yttrium and lanthanum (R).
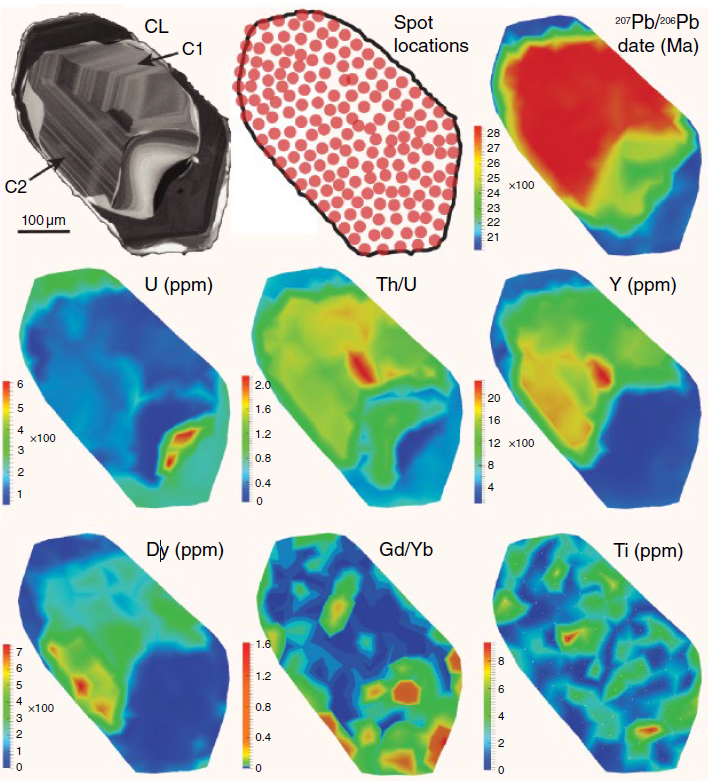
Two-dimensional maps and trace-element variation diagrams of a zoned zircon crystal made using the split-stream laser-ablation technique. At top left is a reference cathodoluminescence (CL) image of the crystal showing an oscillatory zoned core (C1 and C2) surrounded by a mantle, which is in turn enveloped by a younger rim (dark). The crystal was analysed by directing the laser at the array of spots shown at top center. The top right map shows the results of the age determinations and reveals a ~ 2.8-billion-year-old igneous core with oscillatory zoning that was partially resorbed and overgrown in the late Archean and early Paleoproterozoic. The outer rim grew around 2.1 billion years ago. The remaining maps show the measured abundances of the trace elements uranium, thorium-uranium ratio, yttrium, dysprosium, gadolinium, and titanium. These reveal that the trace-element concentrations vary considerably across the crystal, even over regions that have crystallized at the same time. Such microstructure would have been invisible to the prior single or small-number spot analyses.
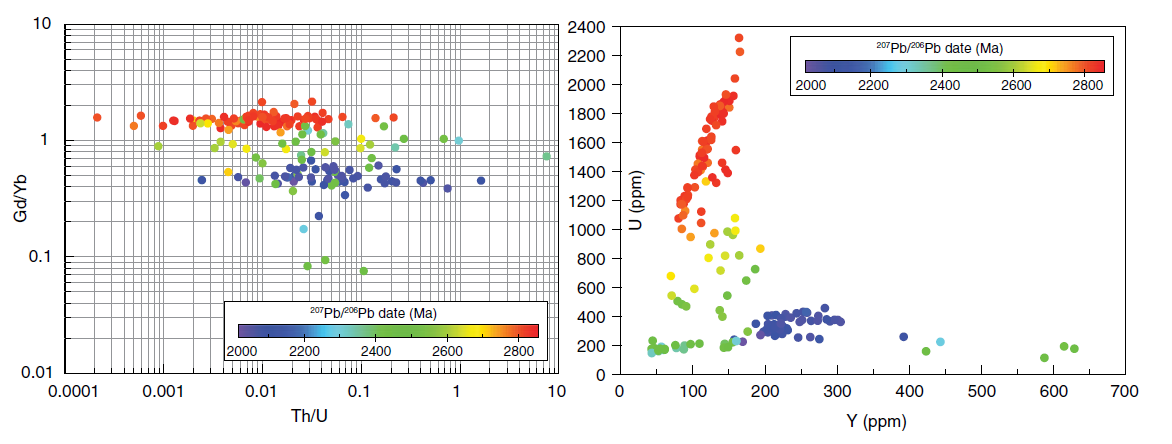
Plots of trace-element concentrations and ratios colored by U-Pb date for the zircon crystal shown in the maps above. The plots show that, for a given age, there is no correlation between the Gd/Yb and Th/U ratios, with the former being essentially constant, and the latter varying over about three orders of magnitude. In contrast, for given age domains, there is a marked positive correlation between U and Y. Correlations among these element concentrations and ratios can provide useful information about the changing nature of the source region from which the zircon crystallized over time.
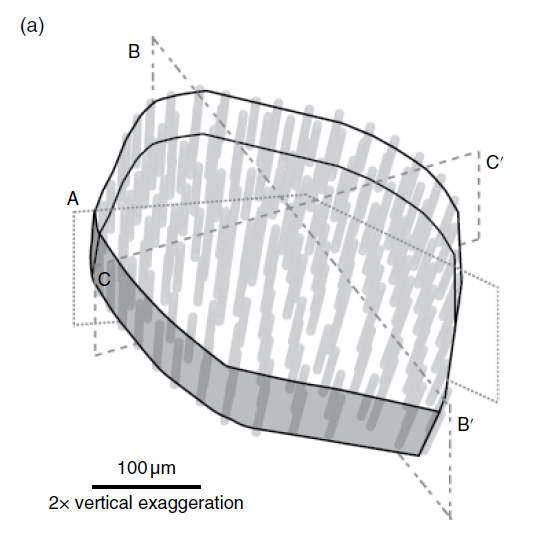
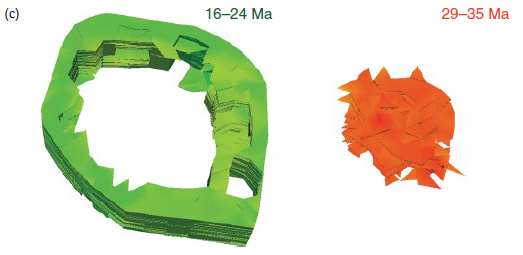
By performing successive measurements while drilling down into a crystal with the laser, it is possible to create three-dimensional maps of the age and trace-element concentration within a single crystal. The example shown here is a zoned Himalayan monazite crystal. (a) Diagram showing the position of each spot analysis. The resulting maps consist of 14,526 individual laser pulses. (b) Three-dimensional isotopic date and trace-element concentration/ratio maps and cross sections. (c) Representation of different age domains identified within the monazite crystal.


The diagram shows how the metamorphic history of a rock has been determined using the methods described in the podcast. The graph, called a pseudosection, is a pressure-temperature phase diagram generated specifically for the modal abundances of elements present in the rock. The shaded areas show the pressure-temperature loci at which the various mineral combinations are stable. These are determined from a series of experiments, phase diagrams, and thermodynamic data over a range of pressure and temperature for a given bulk composition. By obtaining a date for each domain in a rock that exhibits a particular mineral combination, we can obtain a pressure-temperature trajectory over time, as shown by the heavy black arrow. The results indicate that 40 million years ago, the rock was at a pressure of about 7 kbar (corresponding to a depth of about 25 km) at a temperature of 600°C. It was then heated to a temperature of about 630°C, after which, about 33 million years ago, it began to cool during exhumation (dropping pressure). and=andalusite, bt=biotite, chl=chlorite, cor=corundum, crd=cordierite, gnt=garnet, ilm=ilmenite, ky=kyanite, pl=plagioclase, qtz=quartz, ru=rutile, sill=sillimanite, and st=staurolite.

LASS instruments in the UC Santa Barbara petrochronology lab. The instrument in the foreground is a multi-collector inductively-coupled plasma mass spectrometer. The six vertical periscope-looking black boxes are the ion detectors. This instrument is able to measure very precise U-Th-Pb or Sr, Nd, Hf isotopic compositions and is used for the age determinations. The instrument at far left with the orange logo and window is the laser-ablation system. The very thin tube exiting the gold-colored box of the ablation system contains argon and carries the ablated particles into both mass spectrometers. Directly behind the laser (barely visible) is a single-collector inductively-coupled plasma mass spectrometer, which measures trace-element concentrations and/or U-Th-Pb isotopes.
Campaign-Style Study of the Himalaya

Geological map of the Himalaya showing regions where a “campaign-style” study of the Greater Himalayan Sequence was conducted using the split-stream method to obtain U-Pb dates from the mineral titanite. The study used 47 different samples collected by 18 different geologists from various structural levels along over 2,000 km of the Greater Himalayan Sequence from northwest India to central Bhutan. The colors indicate the main geological formations. TSS=Tethyan Sedimentary Sequence; GHS=Greater Himalayan Sequence; LHS=Less Himalayan Sequence. The sample locations are shown by dots that are color-coded according to age, as shown in the map legend. The yellow labels are the names of the analyzed samples. The close-up maps show the regions from which samples were obtained and the ages obtained. a. Sutlej valley. b. Western Nepal. c. Annapurna area. d. Langtang. e. Mt. Everest. f. Eastern Nepal. g. Sikkim. h. Western Bhutan. i. Central Bhutan.

Conceptual model derived from the petrochronological study described above showing multiple slices in the Greater Himalayan Sequence (GHS) in both western (a) and eastern (b) Nepal. MFT=Main Frontal Thrust, MBT=Main Boundary Thrust, MCT=Main Central Thrust, and MHT=Main Himalayan Thrust.
Mottram, C.M., et al. (2019), Geoscience Frontiers 10, 827
Antarctica
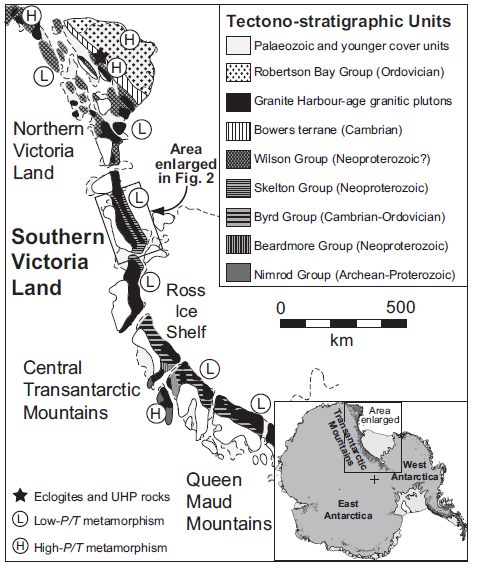
In the podcast, John Cottle describes the application of the new petrochronological methods to a >3,000 km-long belt of deformed and metamorphosed sedimentary rocks in the Ross orogen of Antarctica. The map shows the rock units exposed in the Transantarctic Mountains.
All Antarctica figures from Hagen-Peter, G. et al. (2016), Journal of Metamorphic Geology 34, 293

Field photographs of some of the sampled rocks. (a) Large-scale folds in interlayered marble, calc-silicate, and schist. (b) Sketch interpretation of the outcrop in (a). (c) Multiply-folded marble, which makes up most of the rocks in the study area. (d) Deformed and migmatitic paragneiss hosts intrusions of granite. (e) Migmatitic paragneiss with boudinaged leucosomes. (f) Garnet-tourmaline schist in contact with amphibolite.

Timeline summarizing the geochronology of metamorphic and igneous rocks spanning over 1,500 km along the Ross orogen. Using the techniques described in the podcast, John Cottle and his team identified a longer span of metamorphic events than had previously been seen. This provided evidence for the sequence events shown in the tectonic model of the Ross orogen shown below.

Simplified tectonic model for the evolution of the Ross orogen that explains the petrochronological observations.
New Zealand

John Cottle applied the split-stream laser-ablation methods to unravel the metamorphic history of Zelandia as it separated from Gondwana during the Cretaceous. (A) Map of the study region in New Zealand’s South Island showing the locations from which samples were obtained. The dotted lines show the metamorphic isograds that bound the regions containing the indicated metamorphically-generated minerals. Grt=garnet, Mnz=monazite, Zrn=zircon, and Kspar=K-feldspar. (B) Schematic cross section across South Island along the transect shown in the top left inset in A. The diagram is derived from the metamorphic history obtained from the combined geochronology and trace-element geochemistry of the samples obtained along the fault.
Briggs et al. (2018), Lithosphere, 11, 169
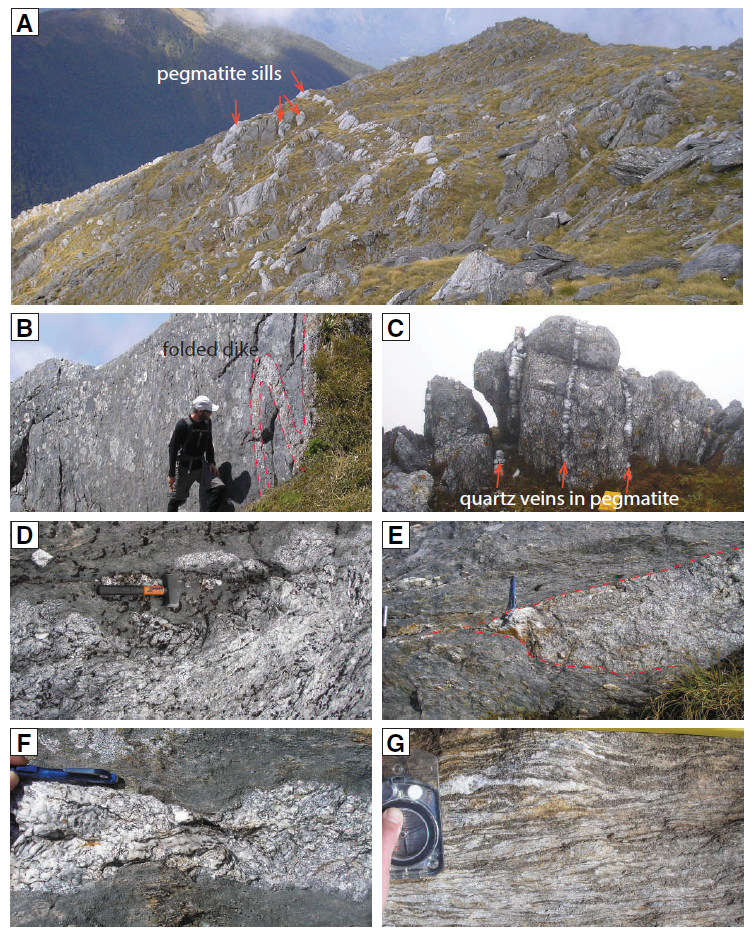
Outcrop photographs of the granitic pegmatites from which the samples for the study referred to above were drawn. (A) Pegmatite sills within the Alpine Schist of New Zealand’s South Island. (B) Isoclinally folded pegmatite dike from which one of the samples was taken. (C) Quartz veins cutting the pegmatite parallel to sill margins. (D) An example of a graded, irregular sill margin. (E) Boudinaged pegmatite sill. (F) Pinching and swelling of a pegmatite. (G) The gneissic host rock surrounding the pegmatites.
Briggs et al. (2018), Lithosphere, 11, 169