
Laurent Jolivet on the Origin of the Mediterranean

Laurent Jolivet is a Professor at the Institute of Earth Sciences at the Sorbonne University. He is an expert on the motions of the lithosphere and the mantle, and has studied the Mediterranean in particular for 30 years. He explains how the Mediterranean formed as a temporary ocean that will eventually be swallowed up by the collision between Africa and Europe.
Courtesy of Damien Do Couto
Listen to the podcast here or wherever you listen to podcasts.
Scroll down for illustrations that support the podcast.
Note - playing the podcast is not supported on Internet Explorer; please use any other browser, or listen on Spotify, Apple Podcasts, etc.
Podcast Illustrations
All images courtesy of Laurent Jolivet unless indicated otherwise.

The animation shows a reconstruction of the Mediterranean region from 35 million years ago to the present. The bold lines represent the subduction zones, with the triangles indicating the overriding plate. All the subduction zones are retreating. For example, the Hellenic subduction zone in the eastern Mediterranean retreats to the south from the latitude of present-day Turkey to just off the coast of Africa. Blue domains are oceanic lithosphere with the rest being continental.

Seismic tomogram of a section running through the Hellenic subduction zone. The fast seismic velocity regions shown in blue reveal the Hellenic slab, which plunges down below the Aegean at about 15 degrees north.
Courtesy of Wim Spakman
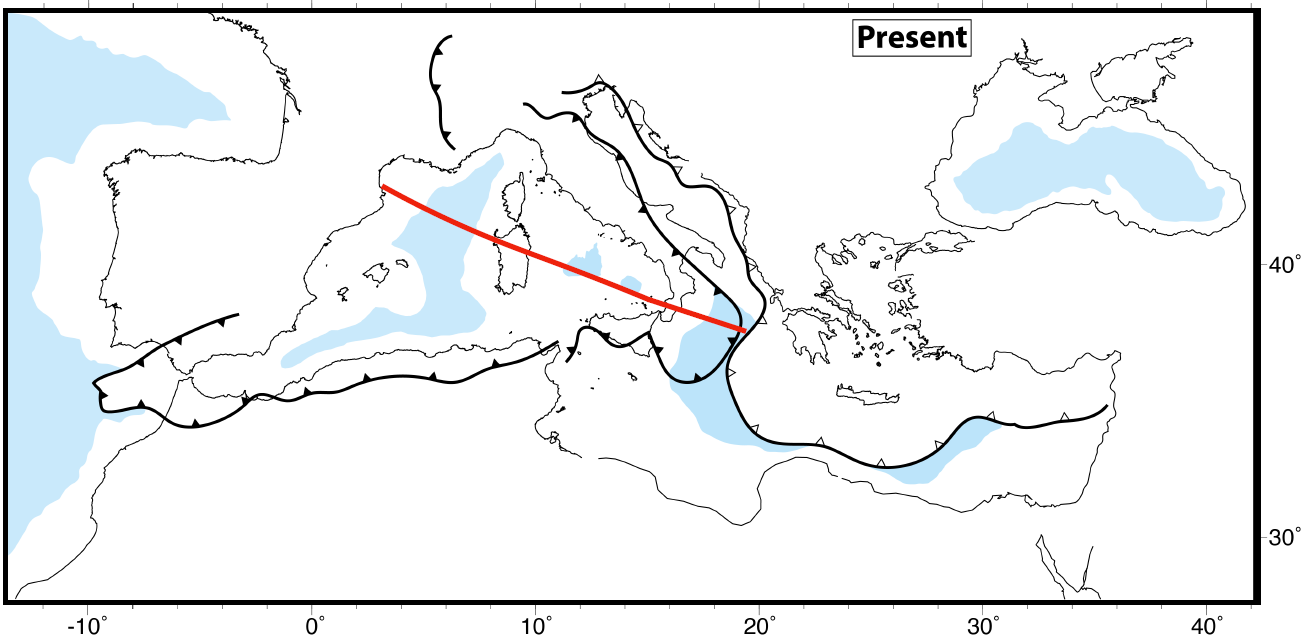
Map showing the line of the cross-section illustrated in the time series reconstruction below.

Reconstruction of the retreating slab along a section from the Pyrenees to Calabria from 35 million years ago to the present.

Animation of the slab retreat shown in the four still frames shown above.

Reconstruction of the evolution of the Gibraltar slab from 50 million years ago to the present. It shows the progressive tearing of the sinking lithosphere. The four images are shown in sequence in the animation below.


Three-dimensional rendering of the present-day slabs underneath the Mediterranean, showing the main subduction zones (red lines) and mantle flow (pink arrows).

Reconstruction of the movement of Africa with respect to Eurasia. The animation also shows the simultaneous evolution of the microcontinent Apulia and of the Mediterranean region. Note that in the podcast, Apulia is referred to as a promontory of Africa, but in this reconstruction it appears to be an island. However, after the Late Jurassic (about 150 million years ago), once the sea-floor spreading ridge that made Apulia rift away from Africa had become extinct, Apulia became part of the African plate, and moved together with it.
This animated reconstruction from 70 million years ago to 10 million years ago shows the slab subducting below the Apennines and retreating to the northeast (i.e., towards the right in the animation). At the northern edge of the subducting slab, anticlockwise toroidal flow in the mantle (shown by the red arrows) pushes the Alps towards the west into France.

This map shows the locations of recent earthquakes in the Mediterranean region, with each circle indicating whether the earthquakes resulted from extensional faulting (blue), compressional faulting (red), or lateral (strike-slip) faulting (yellow). The black lines indicate the main subduction zones. The earthquakes in the Apennines are extensional in nature because the subducting slab to the northeast of the Apennines is retreating, which puts an extensional (stretching) stress on the overriding plate in front of the retreating slab where the Apennines are located.

Anti-clockwise rotation of the eastern Mediterranean and the Middle-East is the result of the lithosphere’s coupling to the mantle below, which is flowing in an anticlockwise toroidal motion. As explained in the podcast, toroidal motion occurs at the edge of subducting slabs that are retreating. Motion indicated by the arrows is obtained from satellite GPS measurements.
Image courtesy of Xavier Le Pichon and Corné Kreemer
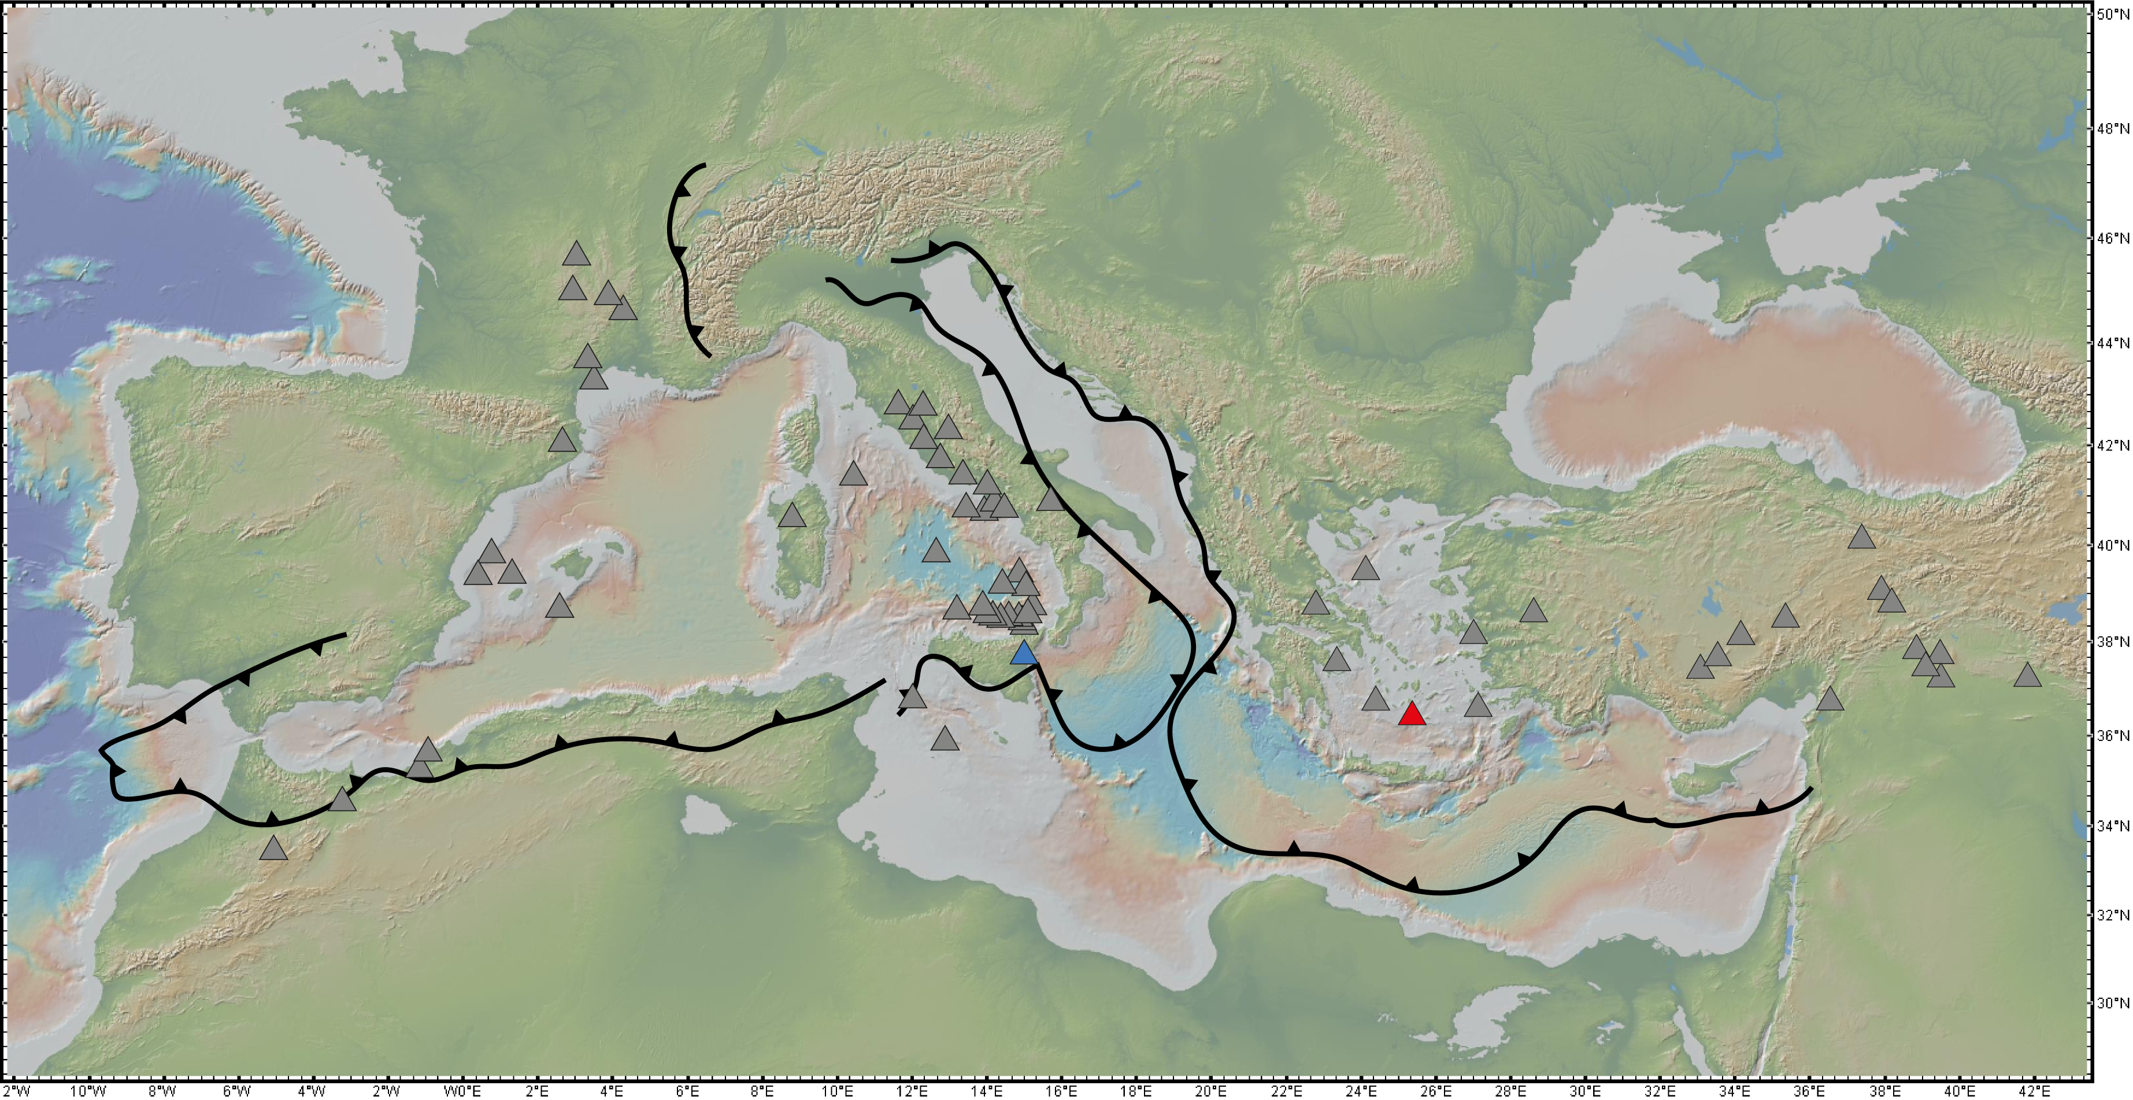
The map shows the locations of volcanos during the Quaternary Period (i.e., the past 2.6 million years), with Mount Etna (blue) and Santorini (red). Santorini and the other Aegean volcanos lie above the subducting Hellenic slab which plunges northwards under the Aegean. The lines indicate the locations of the subduction zone trenches, with the triangle denoting the overriding plate.

The position of the volcanos is superposed over a seismic velocity map. The colors indicate the seismic wave velocity at a depth of 200 km, with red representing slower speeds implying warmer regions, and blue representing faster velocities implying colder regions. The subduction trenches are shown by the pink lines. Both the volcanic arcs along the Apennines and in the Aegean are located above subducting slabs. Mount Etna (blue triangle) is nearly above the southern edge of the Ionian slab shown by the blue patch below Calabria and the northern part of Sicily, placing it above a window between slabs where the magma from the upper mantle (asthenosphere) can reach the surface. Santorini (red triangle), by contrast, is above the middle part of the Hellenic slab sinking below the Aegean region, which corresponds to the normal context for a subduction-related volcano.
Courtesy of Wim Spakman and Laurent Jolivet